1st Assembly District
District
Candidates
| Assembly District 1 Candidates on the Primary Ballot | ||
| Incumbent: Joel Kitchens | ||
Jan 1 thru July 30
|
||
|---|---|---|
| receipts | disbursements | |
| Republican | ||
| Joel Kitchens | $14,009.03 | $12,409.54 |
| Democratic | ||
| Renee A. Paplham | $4,599.55 | $1,636.82 |
| Data from the 2026 July Continuing Report. Any amended reports might not yet be shown. | ||
Past election results
| Election Results in Wisconsin State Assembly District 1 | ||||||
votes
|
Dem. %1 |
margin (Dem. - Rep.)
|
||||
|---|---|---|---|---|---|---|
| total | Dem. | Rep. | votes | points2 | ||
| 2016 President | 33,537 | 13,390 | 18,379 | 42.1% | −4,989 | −15.7 |
| 2016 Senator | 33,457 | 13,103 | 19,235 | 40.5% | −6,132 | −19.0 |
| 2018 Governor | 31,211 | 13,440 | 17,283 | 43.7% | −3,843 | −12.5 |
| 2018 Senator | 31,099 | 15,752 | 15,322 | 50.7% | +430 | +1.4 |
| 2020 President | 38,112 | 15,986 | 21,548 | 42.6% | −5,562 | −14.8 |
| 2022 Governor | 32,078 | 14,155 | 17,565 | 44.6% | −3,410 | −10.8 |
| 2022 Senator | 32,115 | 13,427 | 18,636 | 41.9% | −5,209 | −16.2 |
| 2024 President | 39,529 | 16,597 | 22,428 | 42.5% | −5,831 | −14.9 |
| 2024 Senator | 39,249 | 16,773 | 21,736 | 43.6% | −4,963 | −12.9 |
| 2024 WI Assembly | 38,929 | 14,801 | 24,101 | 38.0% | −9,300 | −23.9 |
| 2025 WI Sup. Ct.3 | 28,055 | 13,371 | 14,672 | 47.7% | −1,301 | −4.6 |
| 1 Share of the two-party vote. For Rep. share, subtract from 100. | ||||||
| 2 Dem % of the two-party vote minus Rep % of the two-party vote | ||||||
| 3 Formally nonpartisan candidates assigned party labels based on state endorsements | ||||||
| Election results allocated into 2024 district boundaries based on population overlap. Calculations by John Johnson (johndjohnson.info). | ||||||
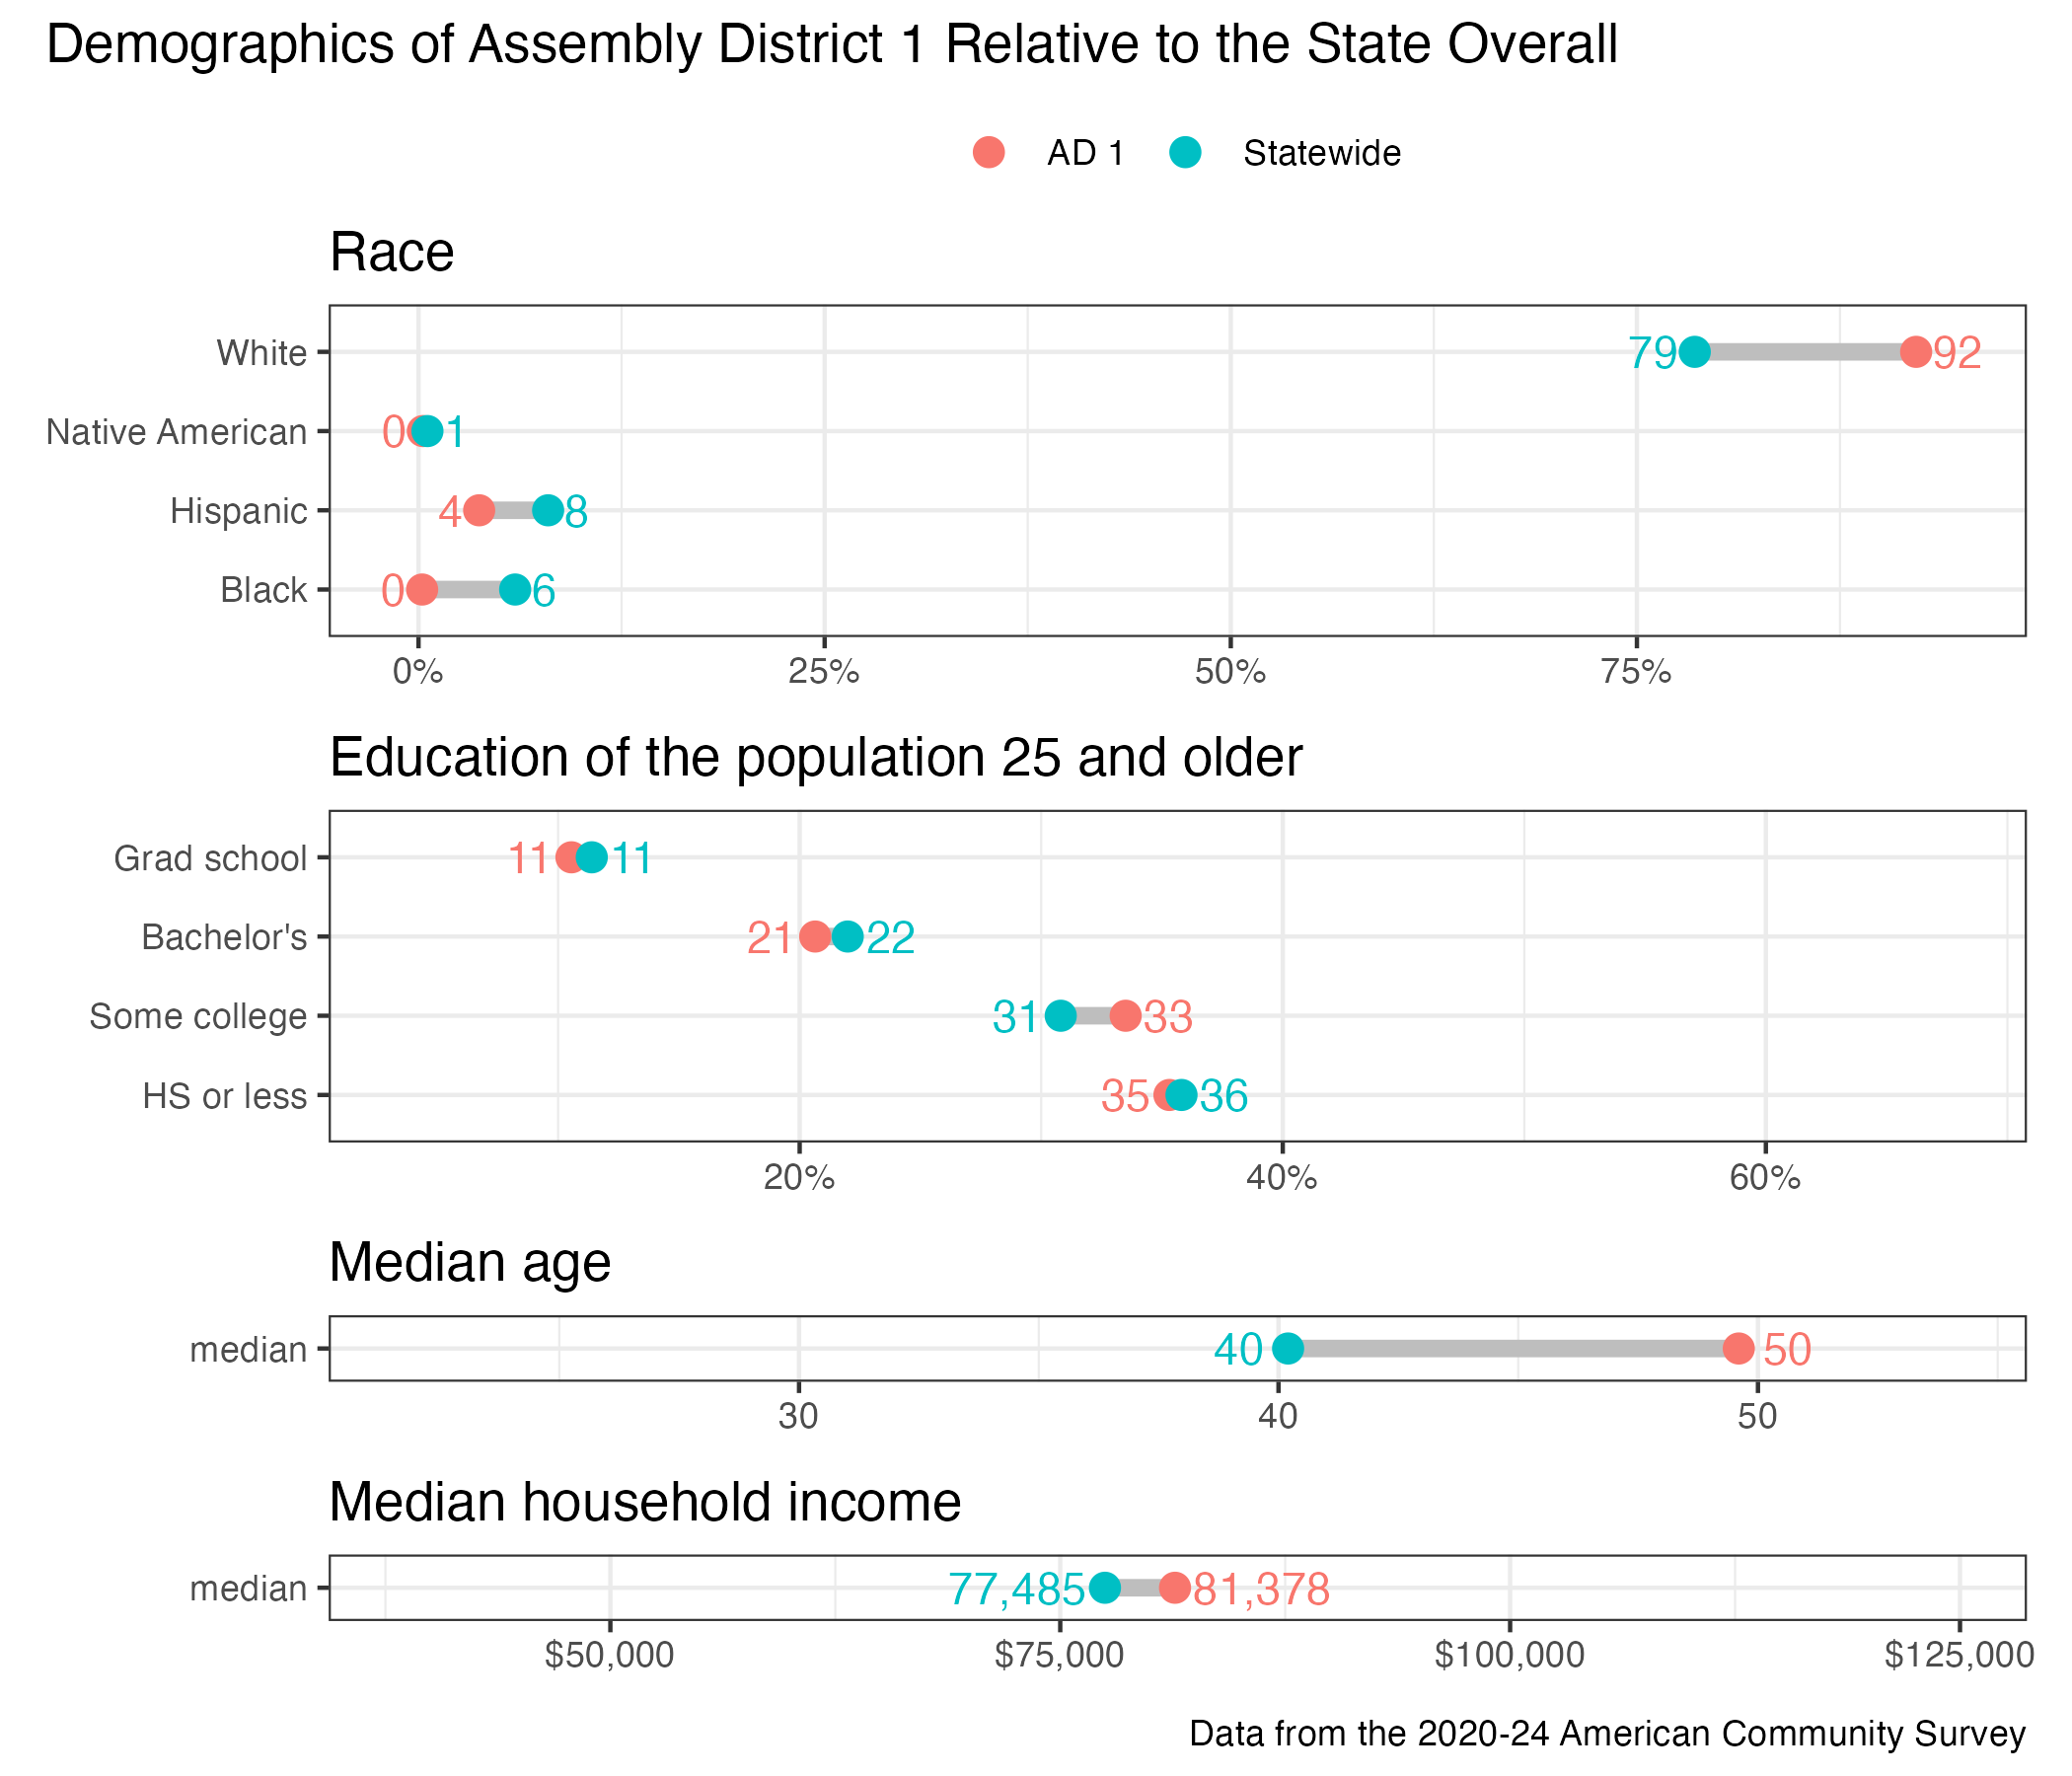
District demographics