57th Assembly District
District
Candidates
| Assembly District 57 Candidates on the Primary Ballot | ||
| Incumbent: Kevin Petersen (Filed Notification of Noncandidacy) | ||
Jan 1 thru July 30
|
||
|---|---|---|
| receipts | disbursements | |
| Republican | ||
| Kevin Krentz | $65,920.00 | $36,509.53 |
| Ed Delgado | $665.00 | $5,038.80 |
| Dylan Testin | $255.00 | $802.56 |
| Bill Lorge | $2,100.00 | $1,492.28 |
| Democratic | ||
| Joey Marschall | $2,222.11 | $1,973.91 |
| Data from the 2026 July Continuing Report. Any amended reports might not yet be shown. | ||
Past election results
| Election Results in Wisconsin State Assembly District 57 | ||||||
votes
|
Dem. %1 |
margin (Dem. - Rep.)
|
||||
|---|---|---|---|---|---|---|
| total | Dem. | Rep. | votes | points2 | ||
| 2016 President | 30,565 | 9,713 | 19,199 | 33.6% | −9,486 | −32.8 |
| 2016 Senator | 30,192 | 9,774 | 19,235 | 33.7% | −9,461 | −32.6 |
| 2018 Governor | 26,893 | 9,511 | 16,916 | 36.0% | −7,405 | −28.0 |
| 2018 Senator | 26,688 | 11,182 | 15,494 | 41.9% | −4,312 | −16.2 |
| 2020 President | 34,397 | 11,293 | 22,579 | 33.3% | −11,286 | −33.3 |
| 2022 Governor | 28,319 | 9,467 | 18,549 | 33.8% | −9,082 | −32.4 |
| 2022 Senator | 28,314 | 8,983 | 19,302 | 31.8% | −10,319 | −36.5 |
| 2024 President | 36,155 | 11,643 | 24,034 | 32.6% | −12,391 | −34.7 |
| 2024 Senator | 35,834 | 11,791 | 23,062 | 33.8% | −11,271 | −32.3 |
| 2024 WI Assembly | 35,377 | 10,048 | 22,044 | 31.3% | −11,996 | −37.4 |
| 2025 WI Sup. Ct.3 | 24,464 | 9,051 | 15,407 | 37.0% | −6,356 | −26.0 |
| 1 Share of the two-party vote. For Rep. share, subtract from 100. | ||||||
| 2 Dem % of the two-party vote minus Rep % of the two-party vote | ||||||
| 3 Formally nonpartisan candidates assigned party labels based on state endorsements | ||||||
| Election results allocated into 2024 district boundaries based on population overlap. Calculations by John Johnson (johndjohnson.info). | ||||||
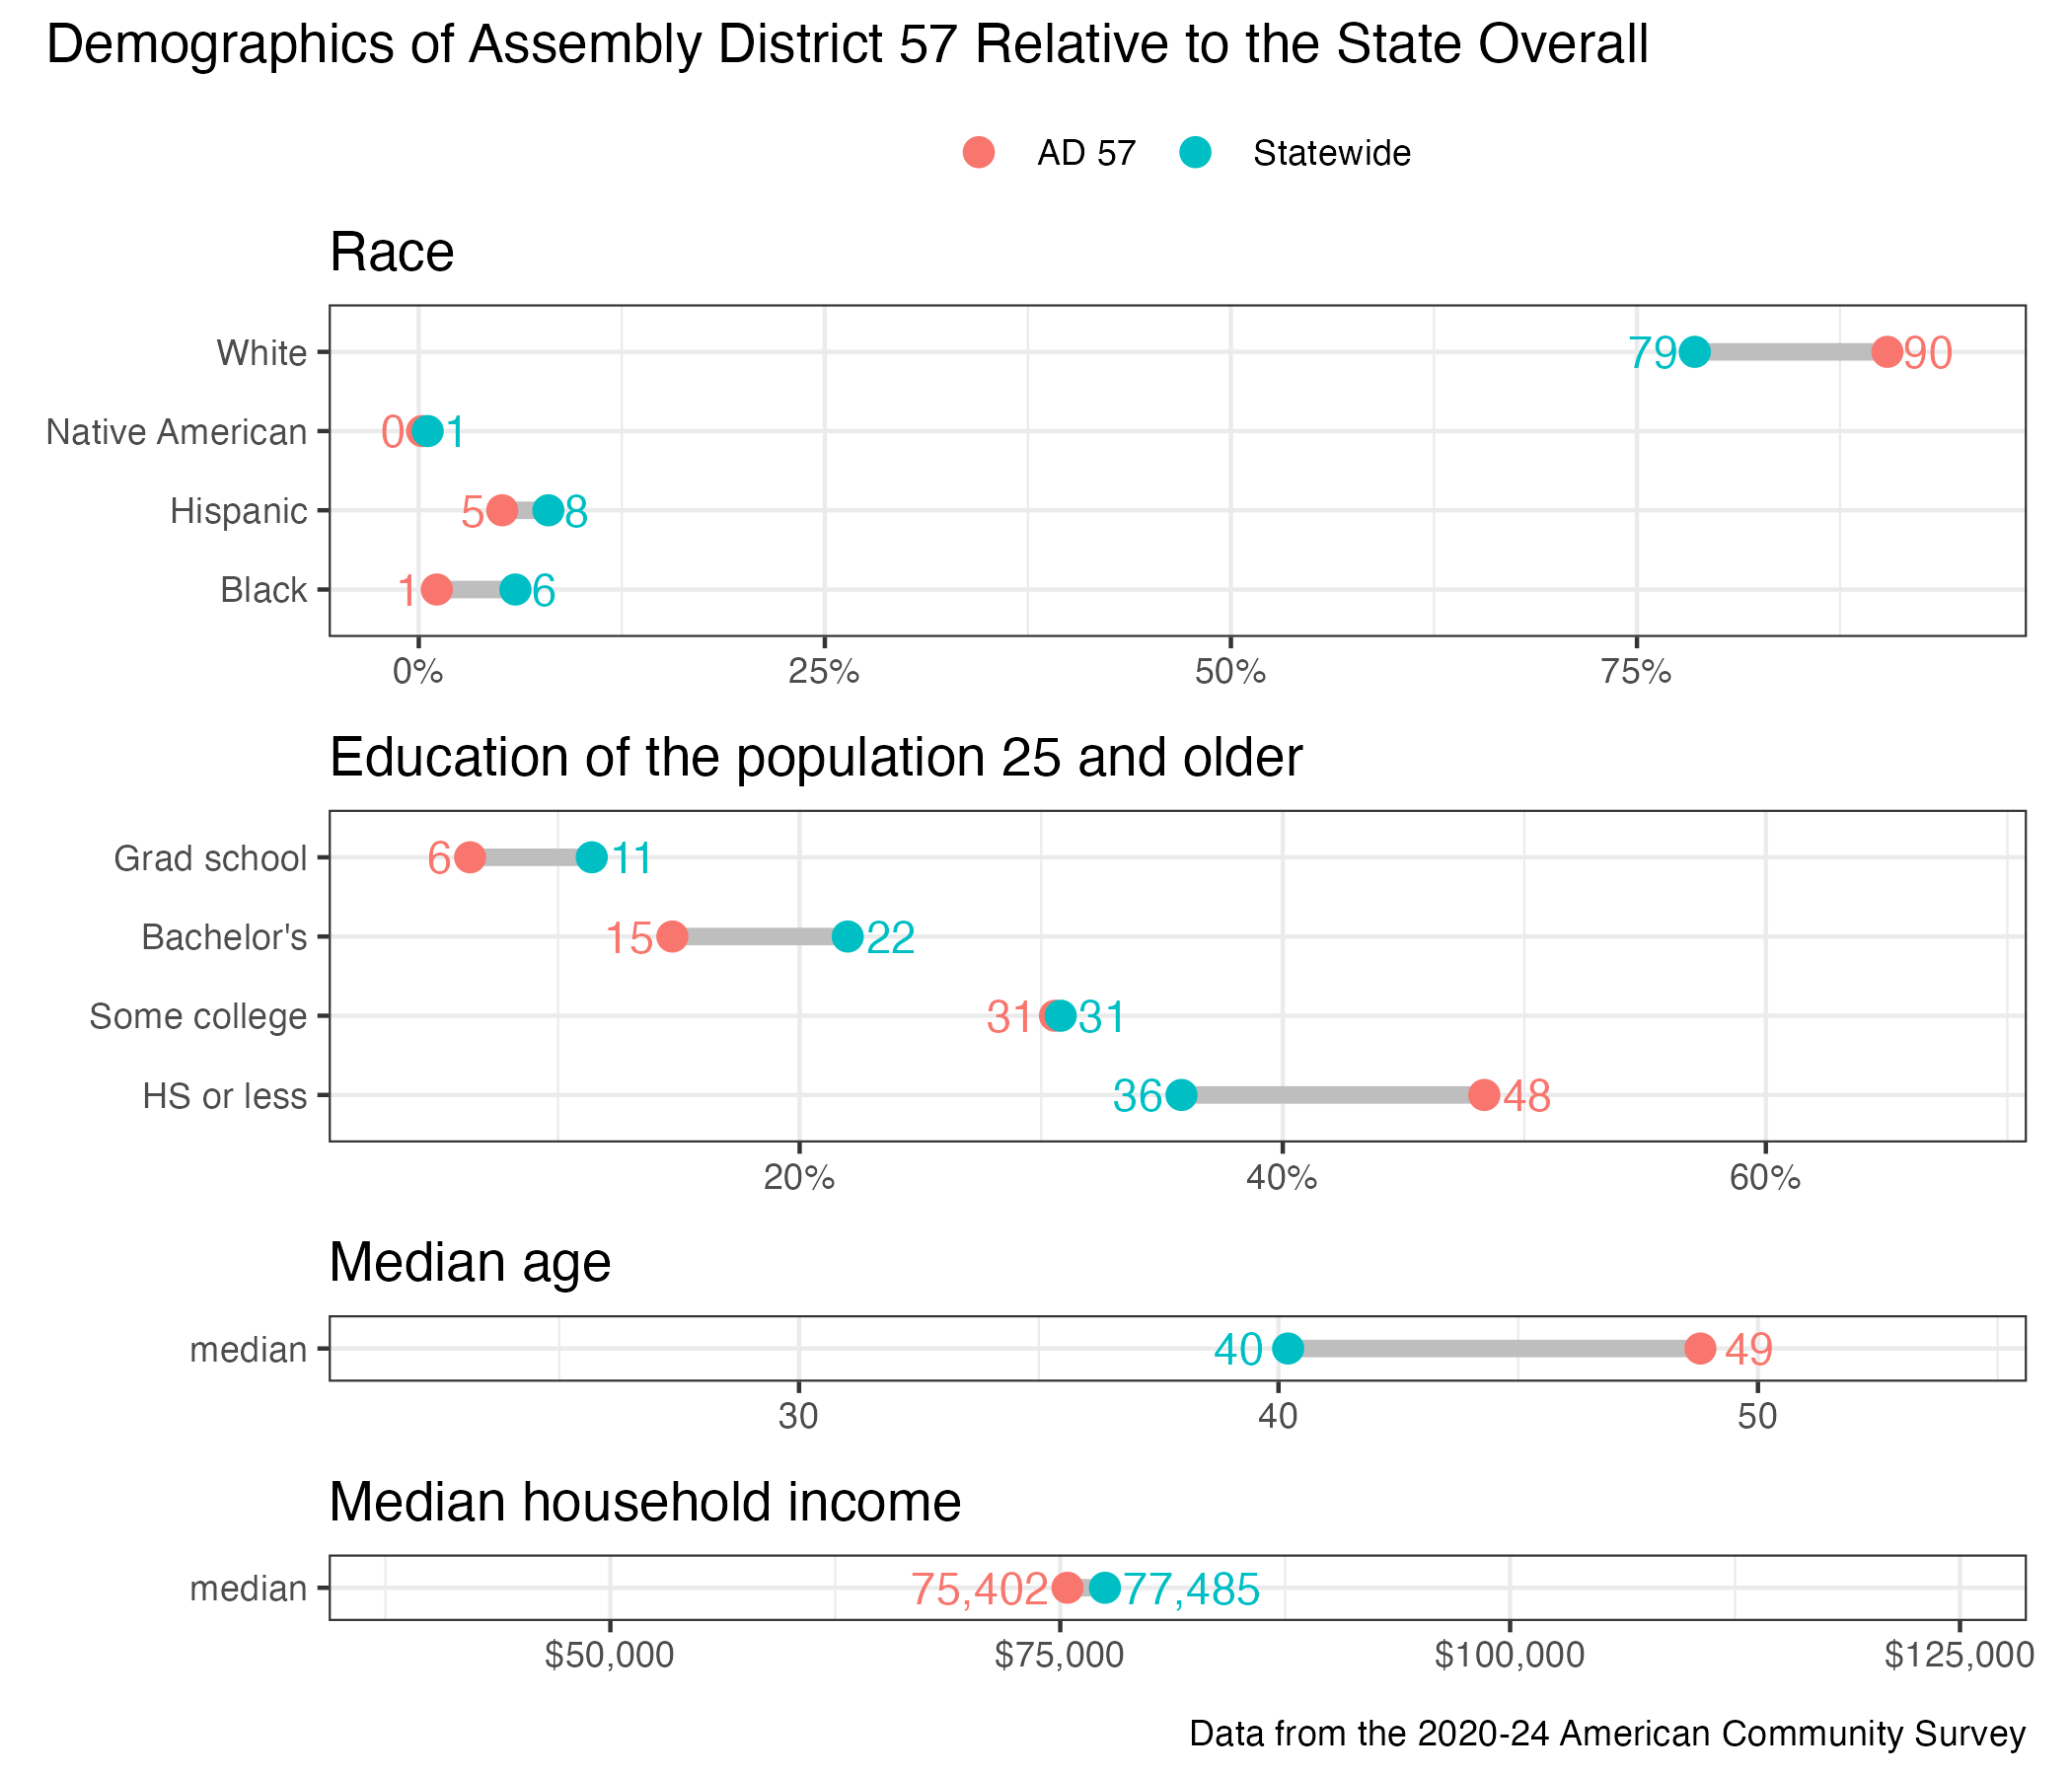
District demographics