39th Assembly District
District
Candidates
| Assembly District 39 Candidates on the Primary Ballot | ||
| Incumbent: Alex Dallman | ||
Jan 1 thru July 30
|
||
|---|---|---|
| receipts | disbursements | |
| Republican | ||
| Alex Dallman | $37,584.00 | $42,948.02 |
| Democratic | ||
| Michael Skivington | $886.50 | $435.38 |
| Data from the 2026 July Continuing Report. Any amended reports might not yet be shown. | ||
Past election results
| Election Results in Wisconsin State Assembly District 39 | ||||||
votes
|
Dem. %1 |
margin (Dem. - Rep.)
|
||||
|---|---|---|---|---|---|---|
| total | Dem. | Rep. | votes | points2 | ||
| 2016 President | 29,782 | 9,455 | 18,671 | 33.6% | −9,216 | −32.8 |
| 2016 Senator | 29,474 | 10,026 | 18,424 | 35.2% | −8,398 | −29.5 |
| 2018 Governor | 26,305 | 9,458 | 16,337 | 36.7% | −6,879 | −26.7 |
| 2018 Senator | 26,052 | 11,125 | 14,908 | 42.7% | −3,783 | −14.5 |
| 2020 President | 33,617 | 11,240 | 21,887 | 33.9% | −10,647 | −32.1 |
| 2022 Governor | 27,666 | 9,372 | 17,942 | 34.3% | −8,570 | −31.4 |
| 2022 Senator | 27,643 | 8,958 | 18,654 | 32.4% | −9,696 | −35.1 |
| 2024 President | 34,594 | 11,278 | 22,789 | 33.1% | −11,511 | −33.8 |
| 2024 Senator | 34,354 | 11,733 | 21,815 | 35.0% | −10,082 | −30.1 |
| 2024 WI Assembly | 33,462 | 10,168 | 23,266 | 30.4% | −13,098 | −39.2 |
| 2025 WI Sup. Ct.3 | 23,509 | 8,777 | 14,728 | 37.3% | −5,951 | −25.3 |
| 1 Share of the two-party vote. For Rep. share, subtract from 100. | ||||||
| 2 Dem % of the two-party vote minus Rep % of the two-party vote | ||||||
| 3 Formally nonpartisan candidates assigned party labels based on state endorsements | ||||||
| Election results allocated into 2024 district boundaries based on population overlap. Calculations by John Johnson (johndjohnson.info). | ||||||
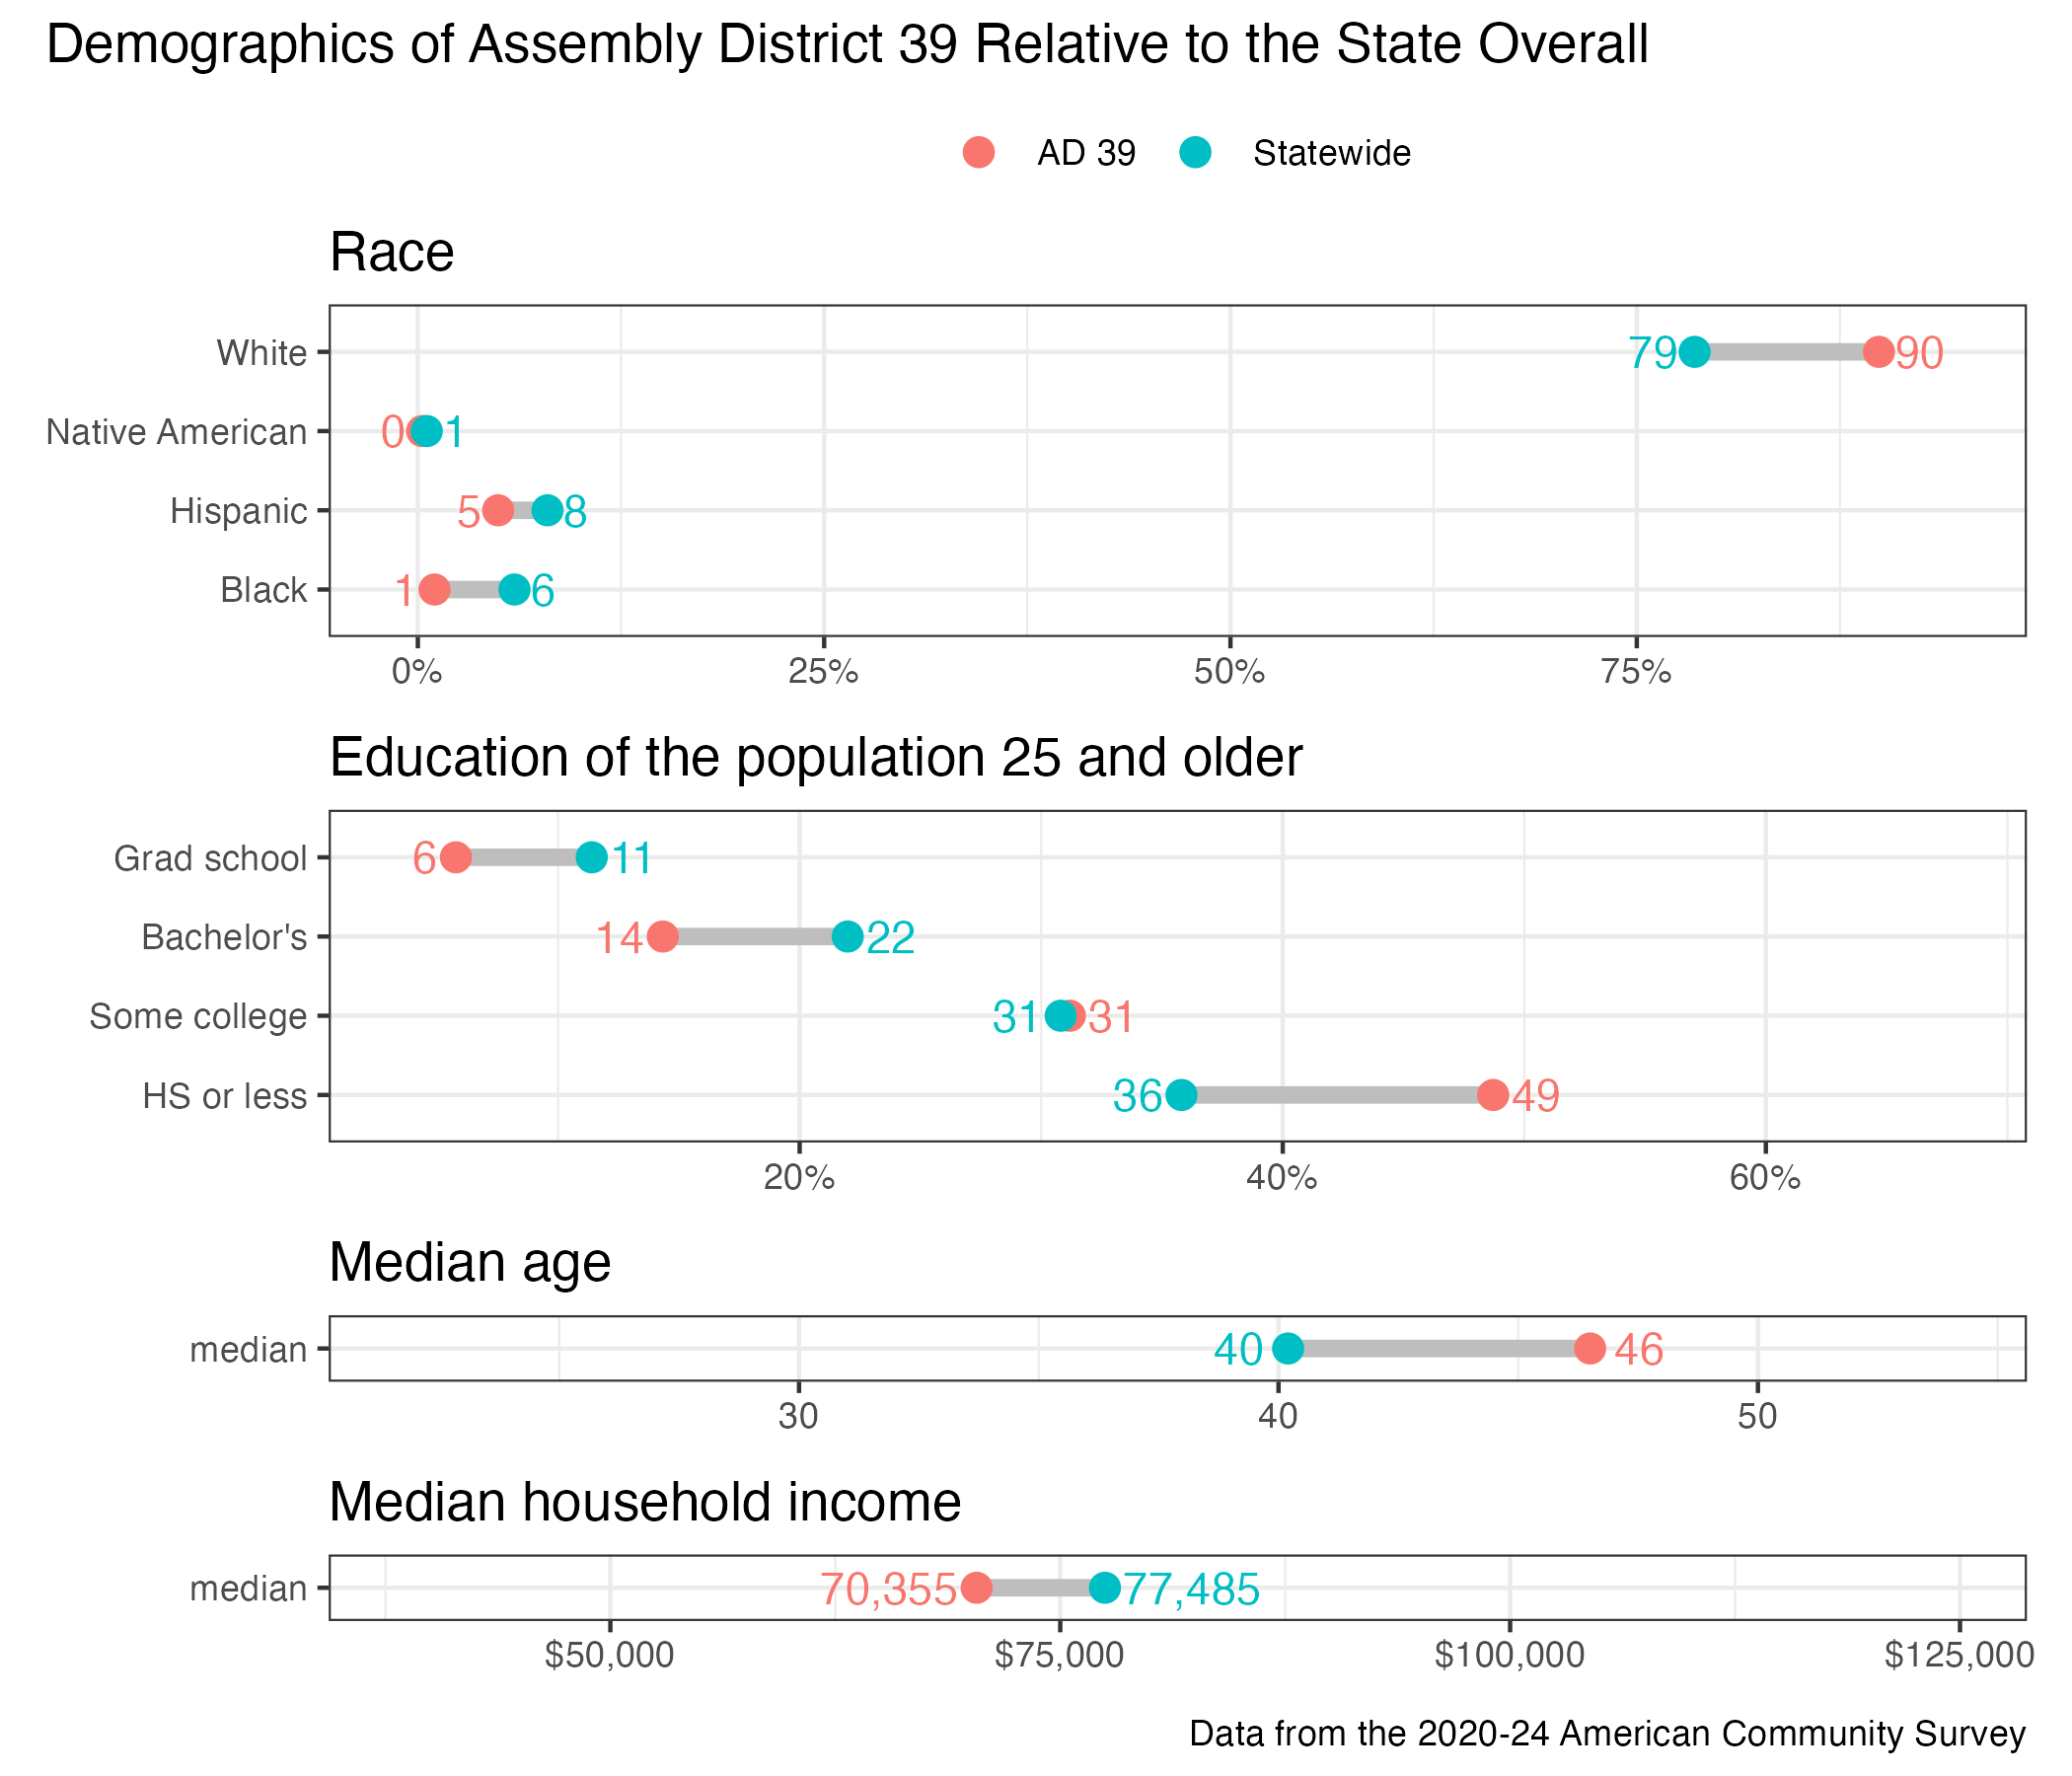
District demographics