86th Assembly District
District
Candidates
| Assembly District 86 Candidates on the Primary Ballot | ||
| Incumbent: John Spiros | ||
Jan 1 thru July 30
|
||
|---|---|---|
| receipts | disbursements | |
| Republican | ||
| John Spiros | $4,940.00 | $6,300.42 |
| Democratic | ||
| Andy Wuethrich | NA | NA |
| Data from the 2026 July Continuing Report. Any amended reports might not yet be shown. | ||
Past election results
| Election Results in Wisconsin State Assembly District 86 | ||||||
votes
|
Dem. %1 |
margin (Dem. - Rep.)
|
||||
|---|---|---|---|---|---|---|
| total | Dem. | Rep. | votes | points2 | ||
| 2016 President | 31,723 | 10,934 | 19,029 | 36.5% | −8,095 | −27.0 |
| 2016 Senator | 31,559 | 11,679 | 18,654 | 38.5% | −6,975 | −23.0 |
| 2018 Governor | 27,864 | 10,171 | 17,264 | 37.1% | −7,093 | −25.9 |
| 2018 Senator | 27,683 | 12,493 | 15,176 | 45.2% | −2,683 | −9.7 |
| 2020 President | 34,726 | 12,491 | 21,747 | 36.5% | −9,256 | −27.0 |
| 2022 Governor | 28,503 | 10,634 | 17,469 | 37.8% | −6,835 | −24.3 |
| 2022 Senator | 28,449 | 10,024 | 18,373 | 35.3% | −8,349 | −29.4 |
| 2024 President | 35,744 | 12,656 | 22,592 | 35.9% | −9,936 | −28.2 |
| 2024 Senator | 35,494 | 13,167 | 21,568 | 37.9% | −8,401 | −24.2 |
| 2024 WI Assembly | 34,877 | 11,513 | 23,331 | 33.0% | −11,818 | −33.9 |
| 2025 WI Sup. Ct.3 | 24,692 | 10,092 | 14,588 | 40.9% | −4,496 | −18.2 |
| 1 Share of the two-party vote. For Rep. share, subtract from 100. | ||||||
| 2 Dem % of the two-party vote minus Rep % of the two-party vote | ||||||
| 3 Formally nonpartisan candidates assigned party labels based on state endorsements | ||||||
| Election results allocated into 2024 district boundaries based on population overlap. Calculations by John Johnson (johndjohnson.info). | ||||||
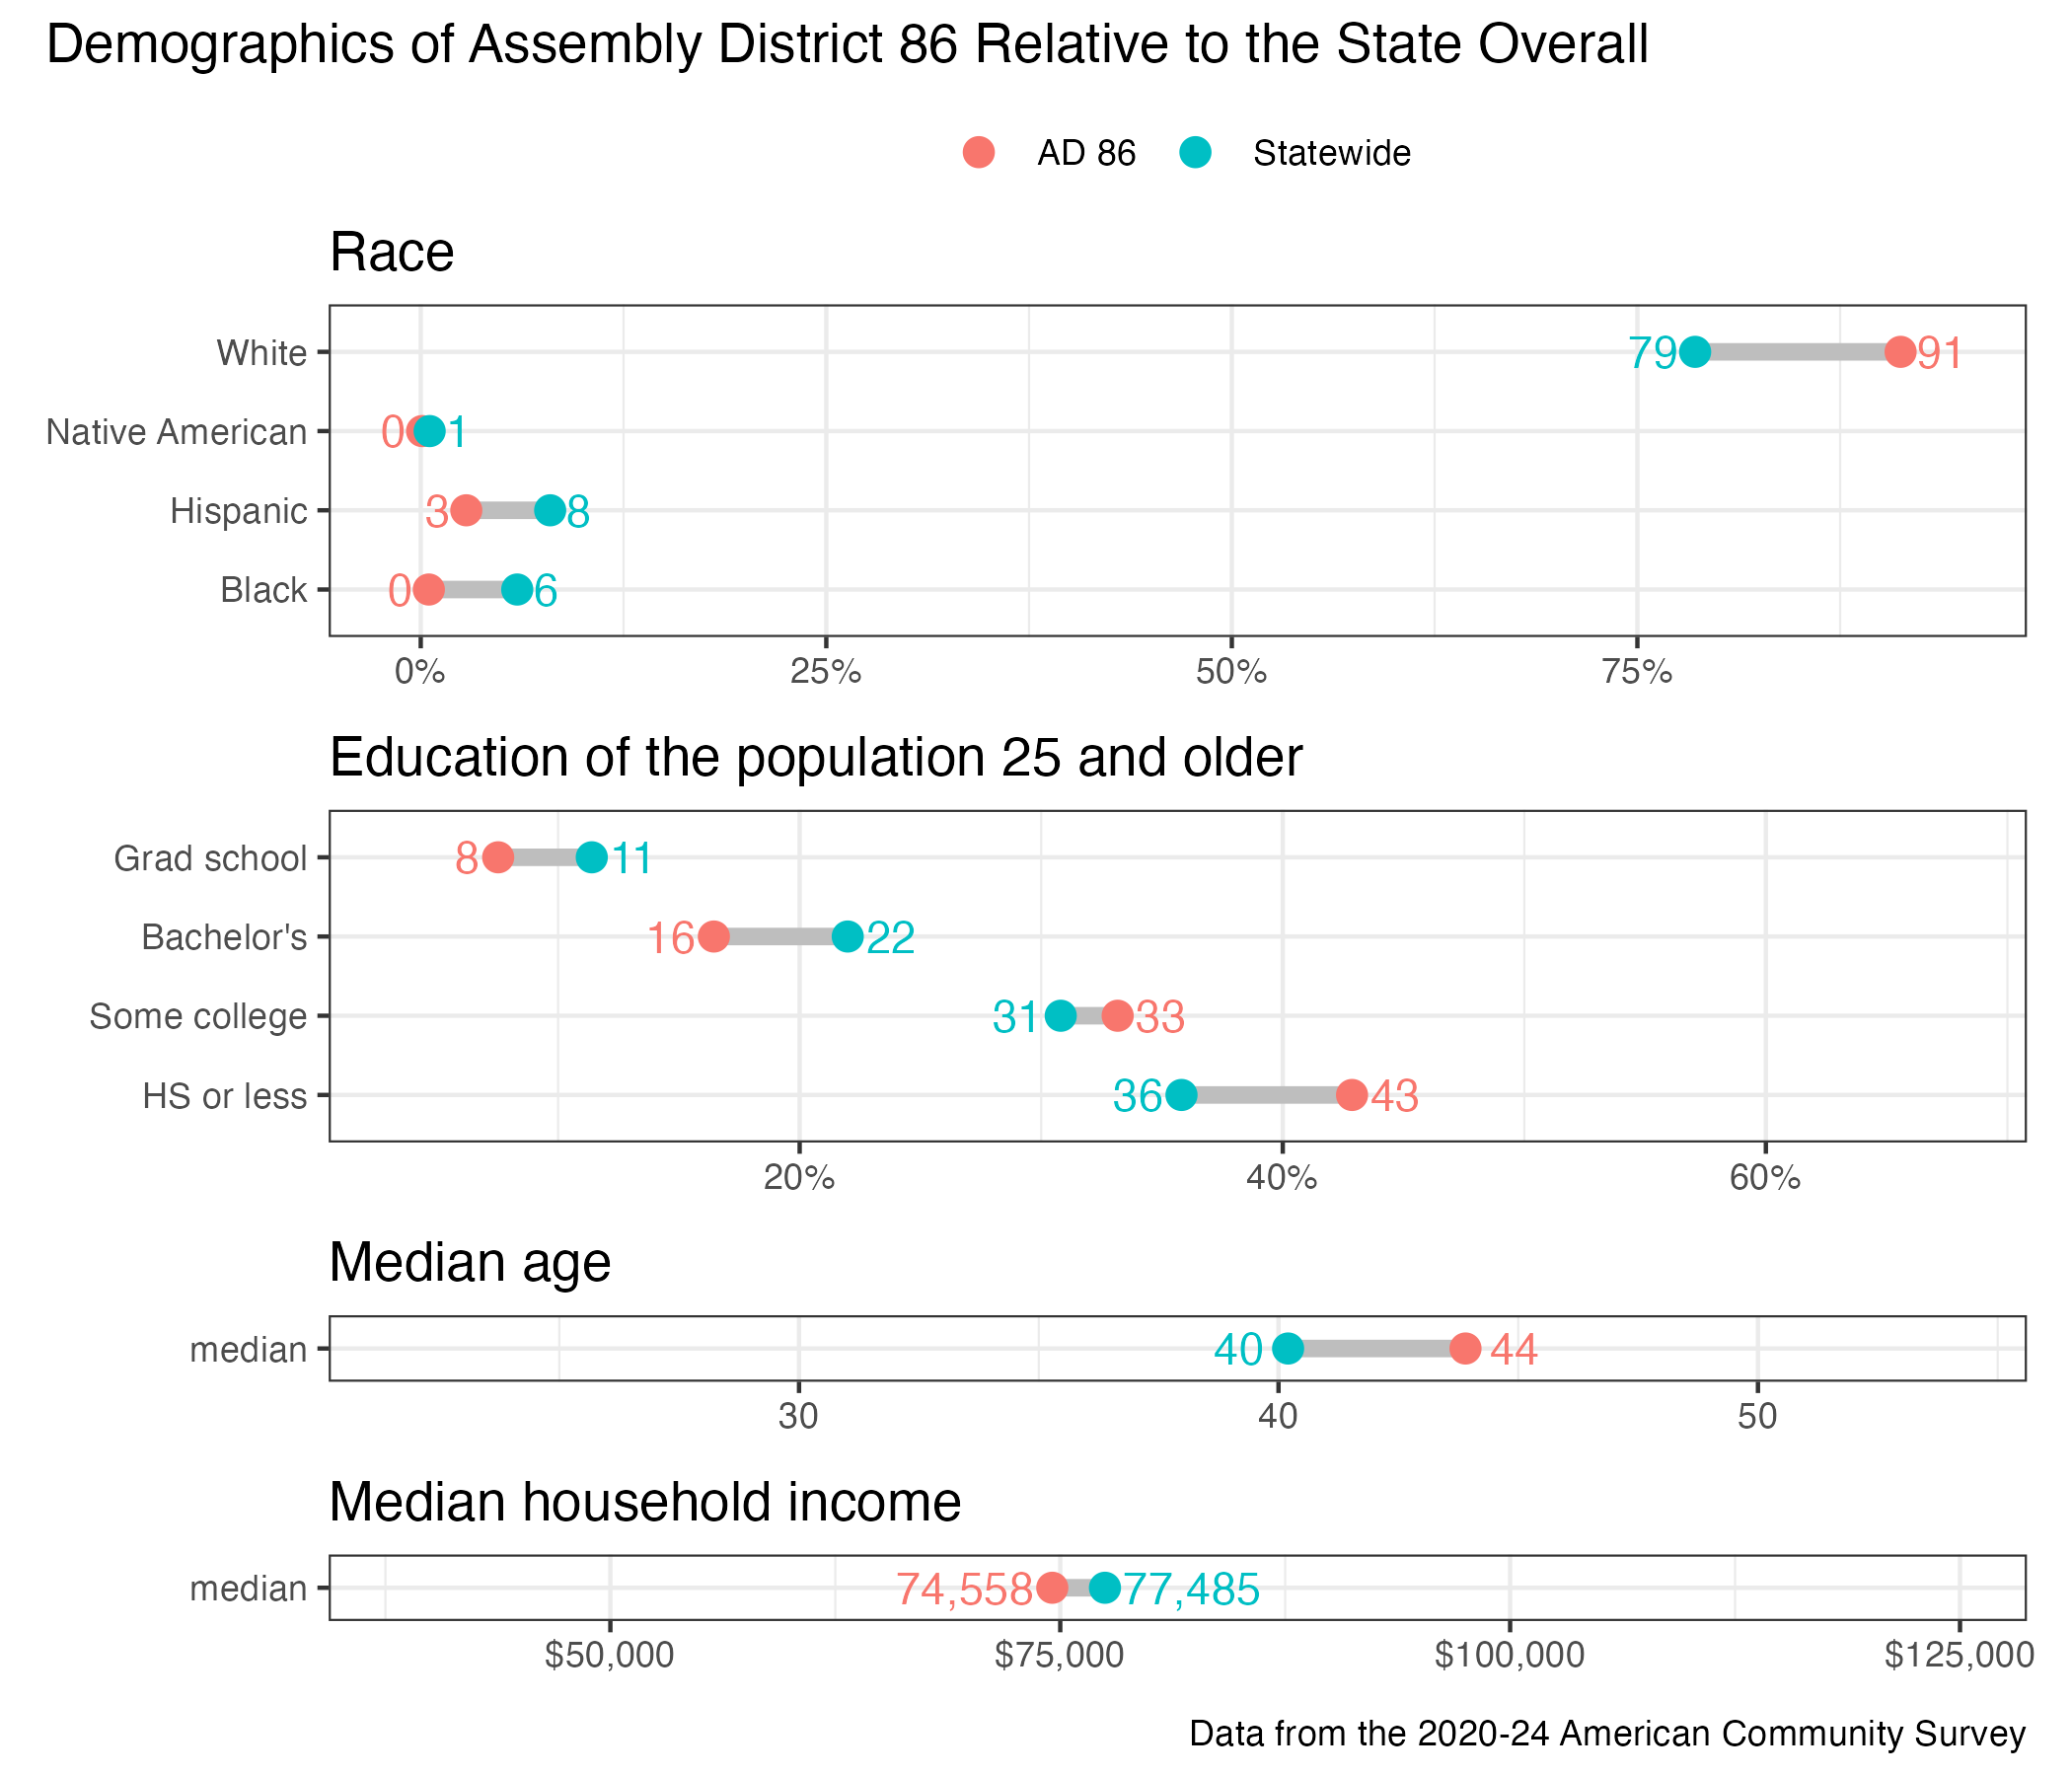
District demographics