23rd Assembly District
District
Candidates
| Assembly District 23 Candidates on the Primary Ballot | ||
| Incumbent: Deb Andraca | ||
Jan 1 thru July 30
|
||
|---|---|---|
| receipts | disbursements | |
| Republican | ||
| Aleaner Pabonnie | $800.00 | $0.00 |
| Democratic | ||
| Deb Andraca | $39,118.00 | $28,524.46 |
| Data from the 2026 July Continuing Report. Any amended reports might not yet be shown. | ||
Past election results
| Election Results in Wisconsin State Assembly District 23 | ||||||
votes
|
Dem. %1 |
margin (Dem. - Rep.)
|
||||
|---|---|---|---|---|---|---|
| total | Dem. | Rep. | votes | points2 | ||
| 2016 President | 36,252 | 20,113 | 13,640 | 59.6% | +6,473 | +19.2 |
| 2016 Senator | 36,222 | 18,115 | 17,652 | 50.6% | +463 | +1.3 |
| 2018 Governor | 34,185 | 18,416 | 15,360 | 54.5% | +3,056 | +9.0 |
| 2018 Senator | 34,072 | 20,315 | 13,717 | 59.7% | +6,598 | +19.4 |
| 2020 President | 39,950 | 25,131 | 14,219 | 63.9% | +10,912 | +27.7 |
| 2022 Governor | 33,363 | 21,460 | 11,709 | 64.7% | +9,751 | +29.4 |
| 2022 Senator | 33,343 | 20,765 | 12,501 | 62.4% | +8,264 | +24.8 |
| 2024 President | 39,340 | 24,879 | 13,726 | 64.4% | +11,153 | +28.9 |
| 2024 Senator | 39,076 | 24,437 | 14,186 | 63.3% | +10,251 | +26.5 |
| 2024 WI Assembly | 38,046 | 23,804 | 14,199 | 62.6% | +9,605 | +25.3 |
| 2025 WI Sup. Ct.3 | 29,845 | 20,500 | 9,330 | 68.7% | +11,170 | +37.4 |
| 1 Share of the two-party vote. For Rep. share, subtract from 100. | ||||||
| 2 Dem % of the two-party vote minus Rep % of the two-party vote | ||||||
| 3 Formally nonpartisan candidates assigned party labels based on state endorsements | ||||||
| Election results allocated into 2024 district boundaries based on population overlap. Calculations by John Johnson (johndjohnson.info). | ||||||
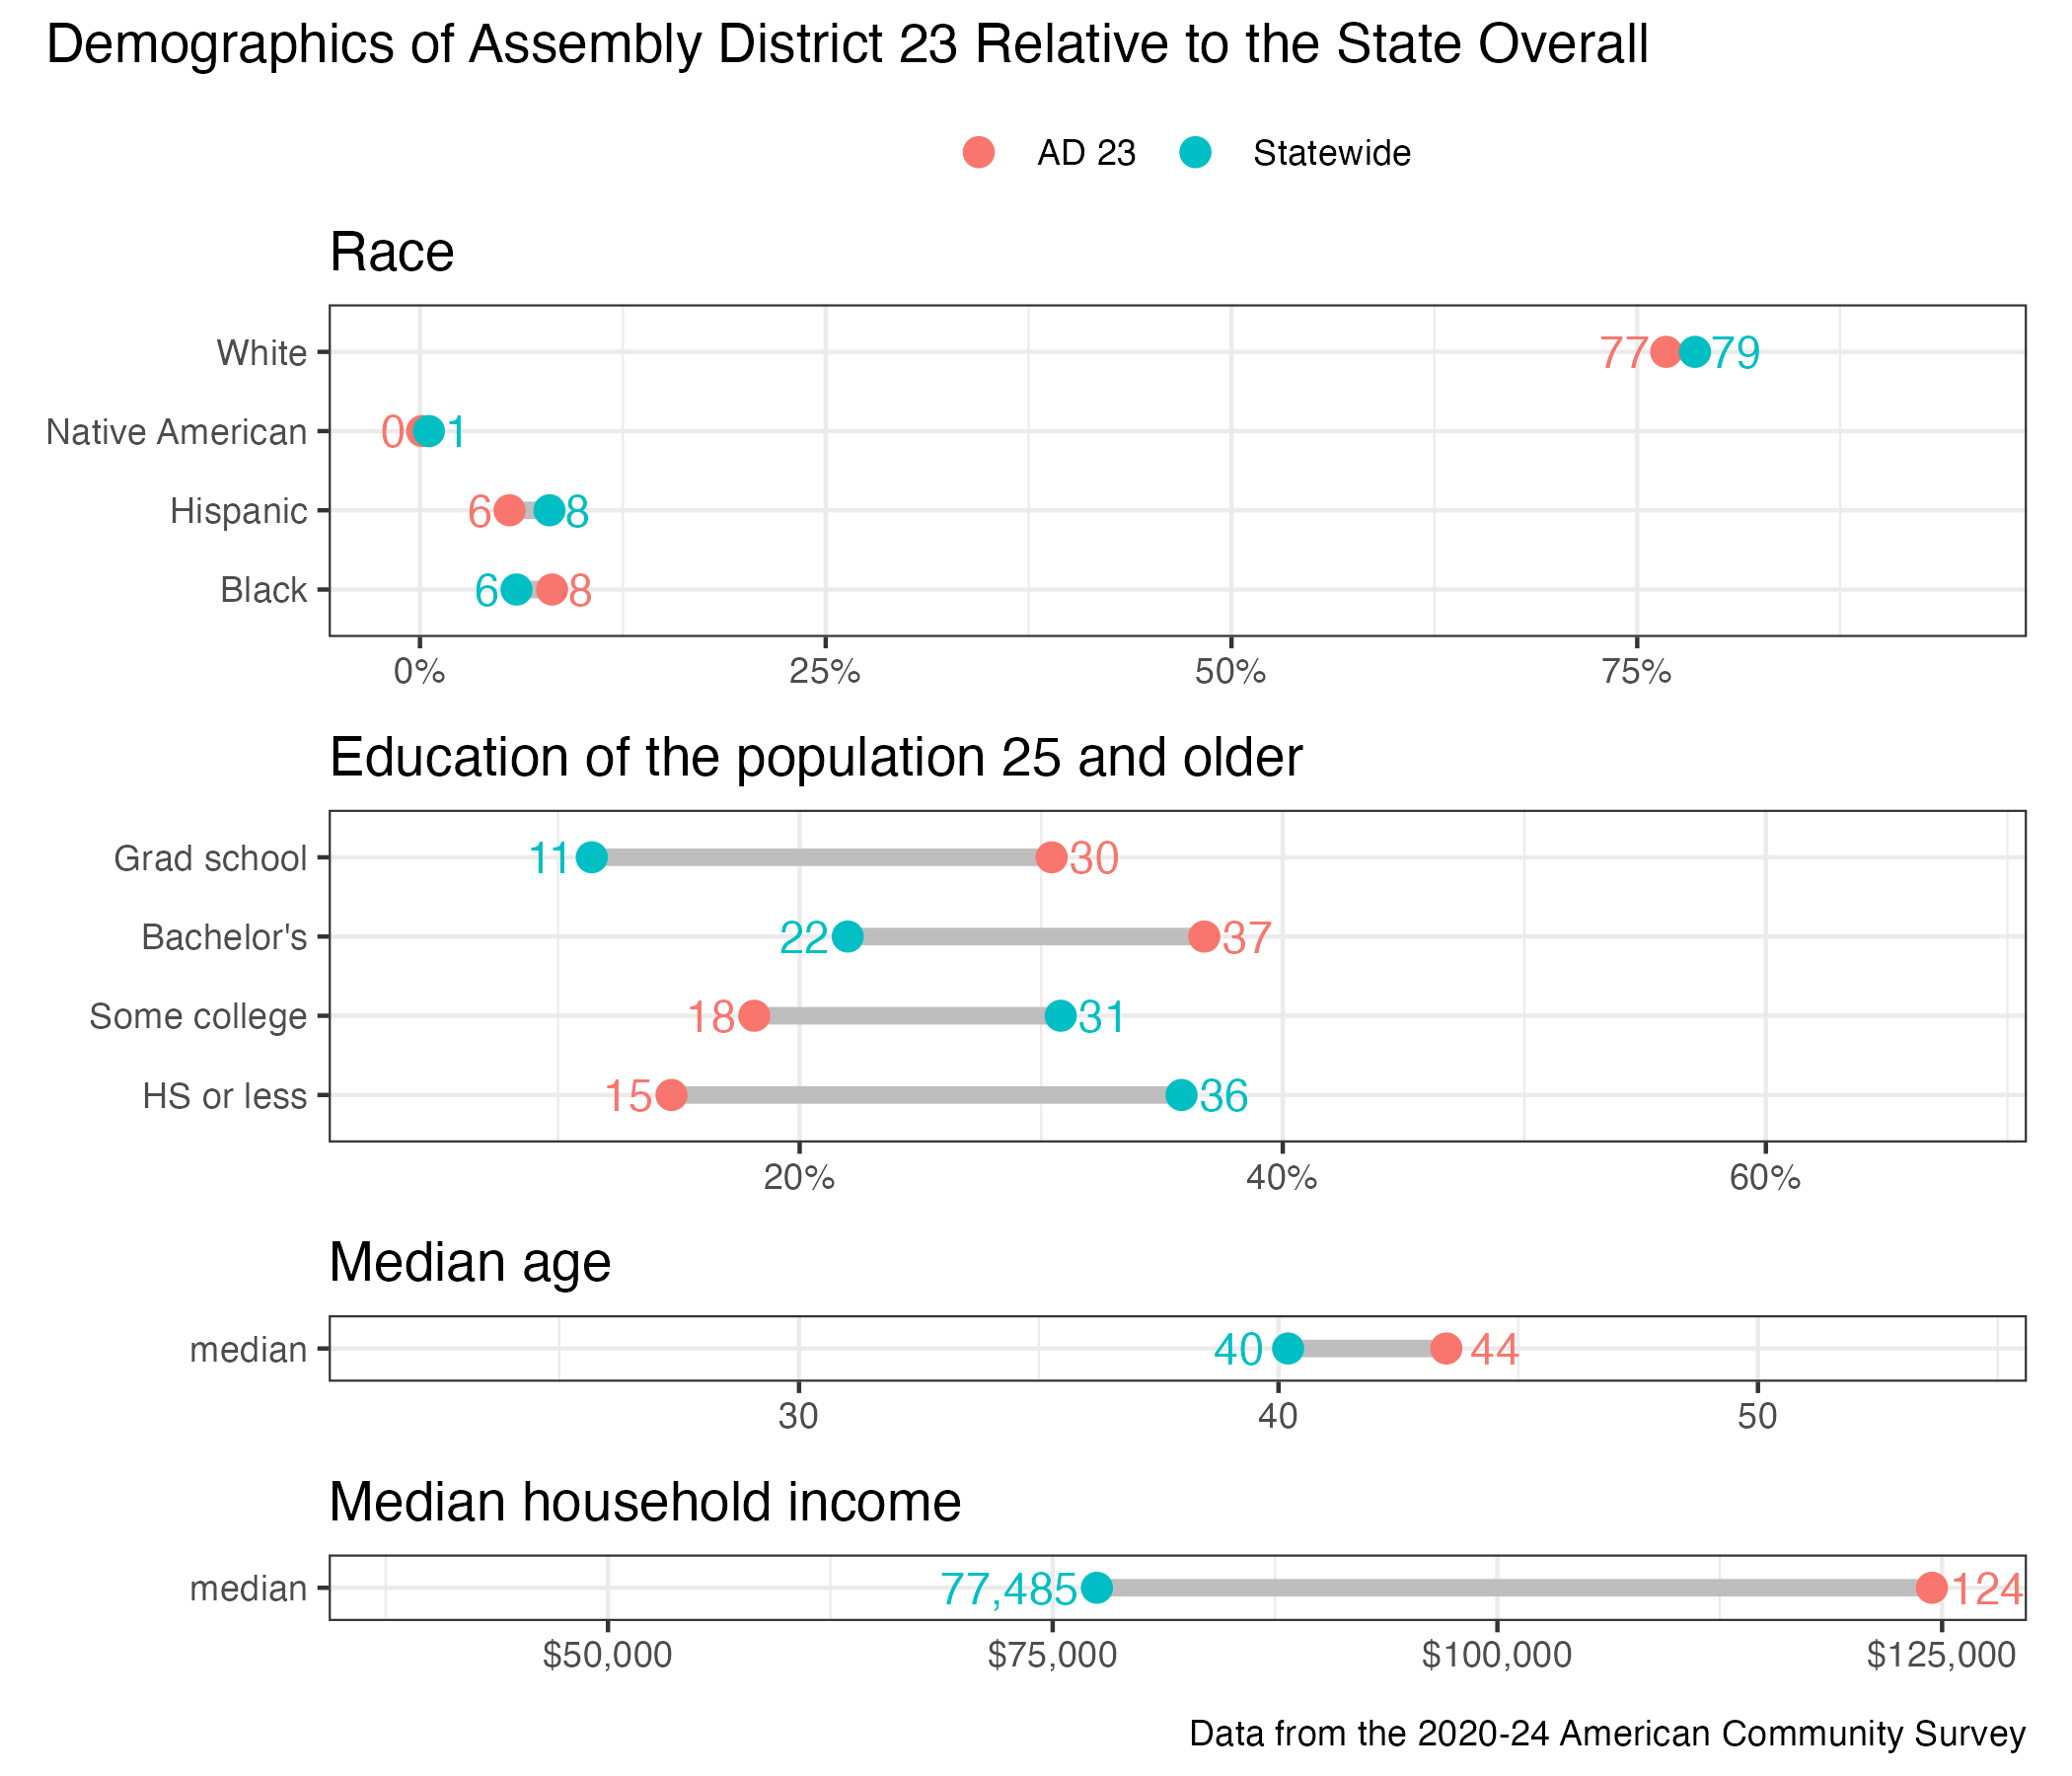
District demographics