44th Assembly District
District
Candidates
| Assembly District 44 Candidates on the Primary Ballot | ||
| Incumbent: Ann Roe | ||
Jan 1 thru July 30
|
||
|---|---|---|
| receipts | disbursements | |
| Republican | ||
| Ron Woodman | $2,000.00 | $462.45 |
| Democratic | ||
| Ann Roe | $14,710.00 | $5,075.52 |
| Data from the 2026 July Continuing Report. Any amended reports might not yet be shown. | ||
Past election results
| Election Results in Wisconsin State Assembly District 44 | ||||||
votes
|
Dem. %1 |
margin (Dem. - Rep.)
|
||||
|---|---|---|---|---|---|---|
| total | Dem. | Rep. | votes | points2 | ||
| 2016 President | 27,304 | 14,383 | 10,936 | 56.8% | +3,447 | +13.6 |
| 2016 Senator | 27,106 | 15,784 | 10,442 | 60.2% | +5,342 | +20.4 |
| 2018 Governor | 24,445 | 14,801 | 8,996 | 62.2% | +5,805 | +24.4 |
| 2018 Senator | 24,304 | 15,691 | 8,581 | 64.6% | +7,110 | +29.3 |
| 2020 President | 30,576 | 17,209 | 12,765 | 57.4% | +4,444 | +14.8 |
| 2022 Governor | 23,526 | 14,156 | 9,059 | 61.0% | +5,097 | +22.0 |
| 2022 Senator | 23,405 | 13,575 | 9,772 | 58.1% | +3,803 | +16.3 |
| 2024 President | 31,749 | 17,301 | 13,873 | 55.5% | +3,428 | +11.0 |
| 2024 Senator | 31,432 | 17,372 | 13,177 | 56.9% | +4,195 | +13.7 |
| 2024 WI Assembly | 30,743 | 17,335 | 13,371 | 56.5% | +3,964 | +12.9 |
| 2025 WI Sup. Ct.3 | 20,461 | 13,037 | 7,403 | 63.8% | +5,634 | +27.6 |
| 1 Share of the two-party vote. For Rep. share, subtract from 100. | ||||||
| 2 Dem % of the two-party vote minus Rep % of the two-party vote | ||||||
| 3 Formally nonpartisan candidates assigned party labels based on state endorsements | ||||||
| Election results allocated into 2024 district boundaries based on population overlap. Calculations by John Johnson (johndjohnson.info). | ||||||
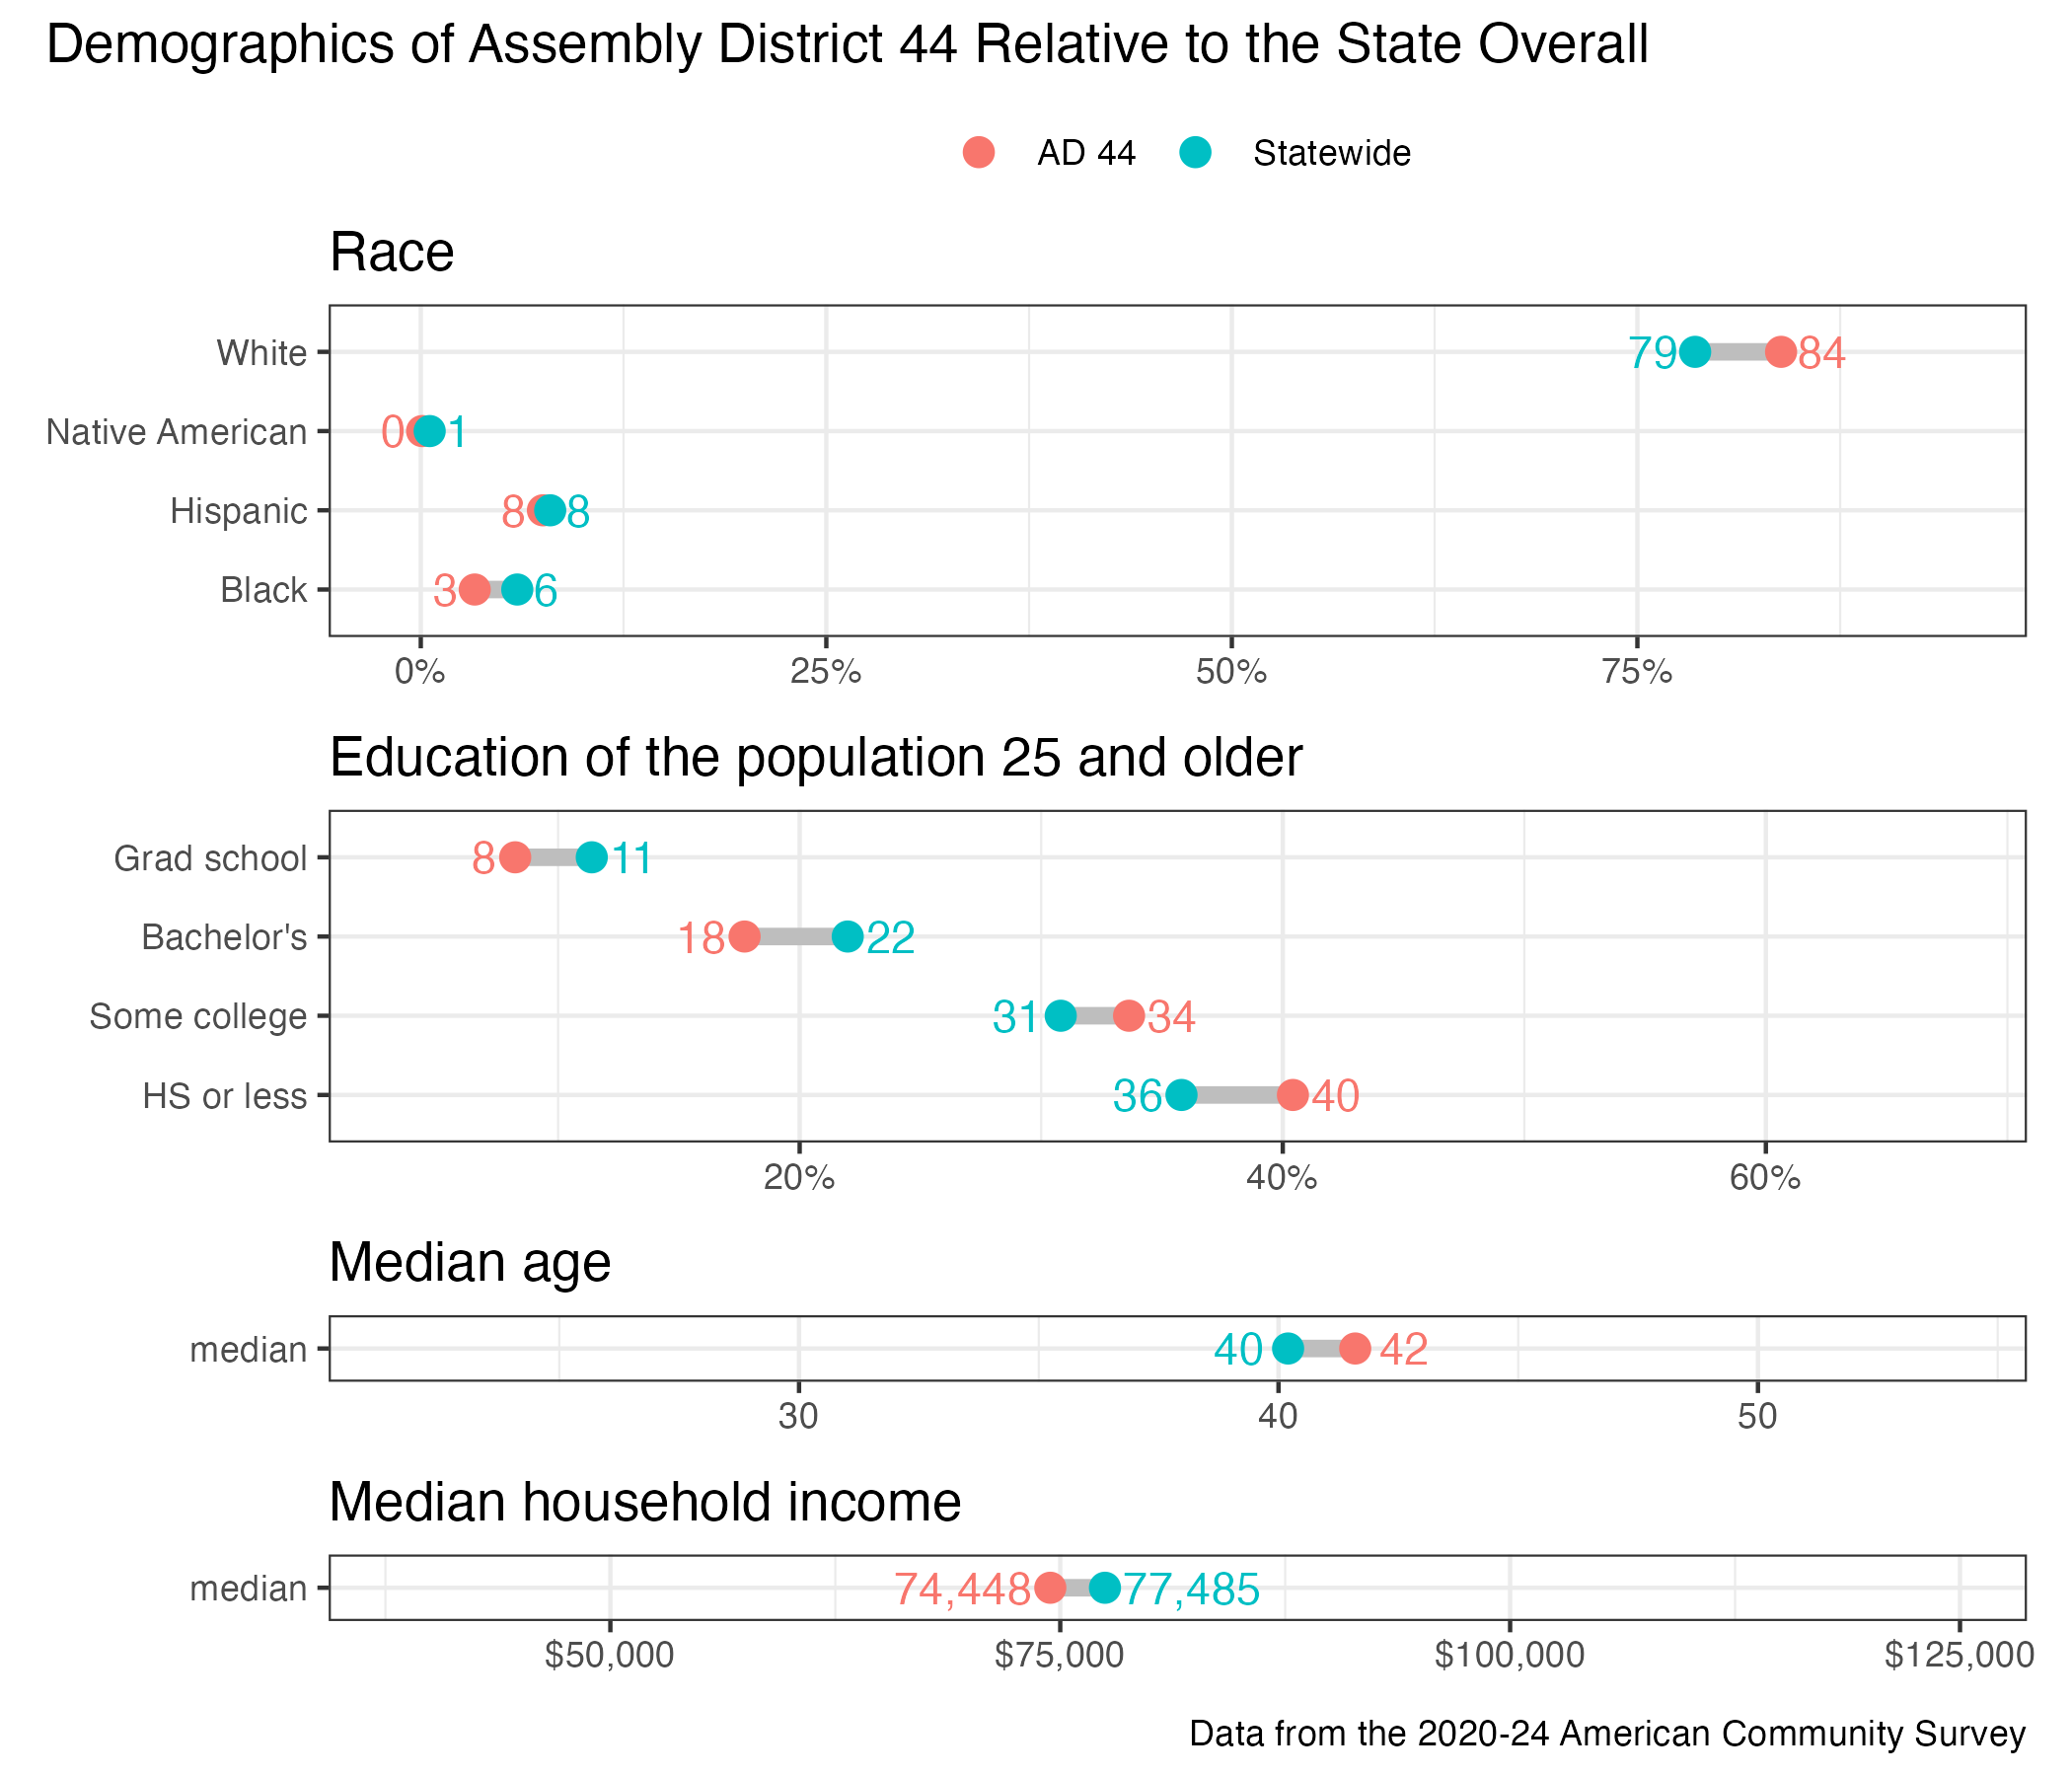
District demographics