13th Assembly District
District
Candidates
| Assembly District 13 Candidates on the Primary Ballot | ||
| Incumbent: Robyn Vining (Filed Notification of Noncandidacy) | ||
Jan 1 thru July 30
|
||
|---|---|---|
| receipts | disbursements | |
| Republican | ||
| Mike Morgan | $0.00 | $0.00 |
| Democratic | ||
| Amy Zimmerman | $34,141.91 | $34,011.04 |
| David Sanchez | $67,540.50 | $17,352.08 |
| Data from the 2026 July Continuing Report. Any amended reports might not yet be shown. | ||
Past election results
| Election Results in Wisconsin State Assembly District 13 | ||||||
votes
|
Dem. %1 |
margin (Dem. - Rep.)
|
||||
|---|---|---|---|---|---|---|
| total | Dem. | Rep. | votes | points2 | ||
| 2016 President | 35,929 | 17,355 | 15,890 | 52.2% | +1,465 | +4.4 |
| 2016 Senator | 36,037 | 15,650 | 19,779 | 44.2% | −4,129 | −11.7 |
| 2018 Governor | 34,366 | 16,279 | 17,612 | 48.0% | −1,333 | −3.9 |
| 2018 Senator | 34,294 | 17,997 | 16,236 | 52.6% | +1,761 | +5.1 |
| 2020 President | 39,679 | 22,545 | 16,393 | 57.9% | +6,152 | +15.8 |
| 2022 Governor | 33,977 | 19,997 | 13,735 | 59.3% | +6,262 | +18.6 |
| 2022 Senator | 33,947 | 19,261 | 14,596 | 56.9% | +4,665 | +13.8 |
| 2024 President | 40,236 | 23,836 | 15,596 | 60.4% | +8,240 | +20.9 |
| 2024 Senator | 40,009 | 23,295 | 16,200 | 59.0% | +7,095 | +18.0 |
| 2024 WI Assembly | 39,384 | 22,540 | 16,796 | 57.3% | +5,744 | +14.6 |
| 2025 WI Sup. Ct.3 | 31,533 | 19,918 | 11,593 | 63.2% | +8,325 | +26.4 |
| 1 Share of the two-party vote. For Rep. share, subtract from 100. | ||||||
| 2 Dem % of the two-party vote minus Rep % of the two-party vote | ||||||
| 3 Formally nonpartisan candidates assigned party labels based on state endorsements | ||||||
| Election results allocated into 2024 district boundaries based on population overlap. Calculations by John Johnson (johndjohnson.info). | ||||||
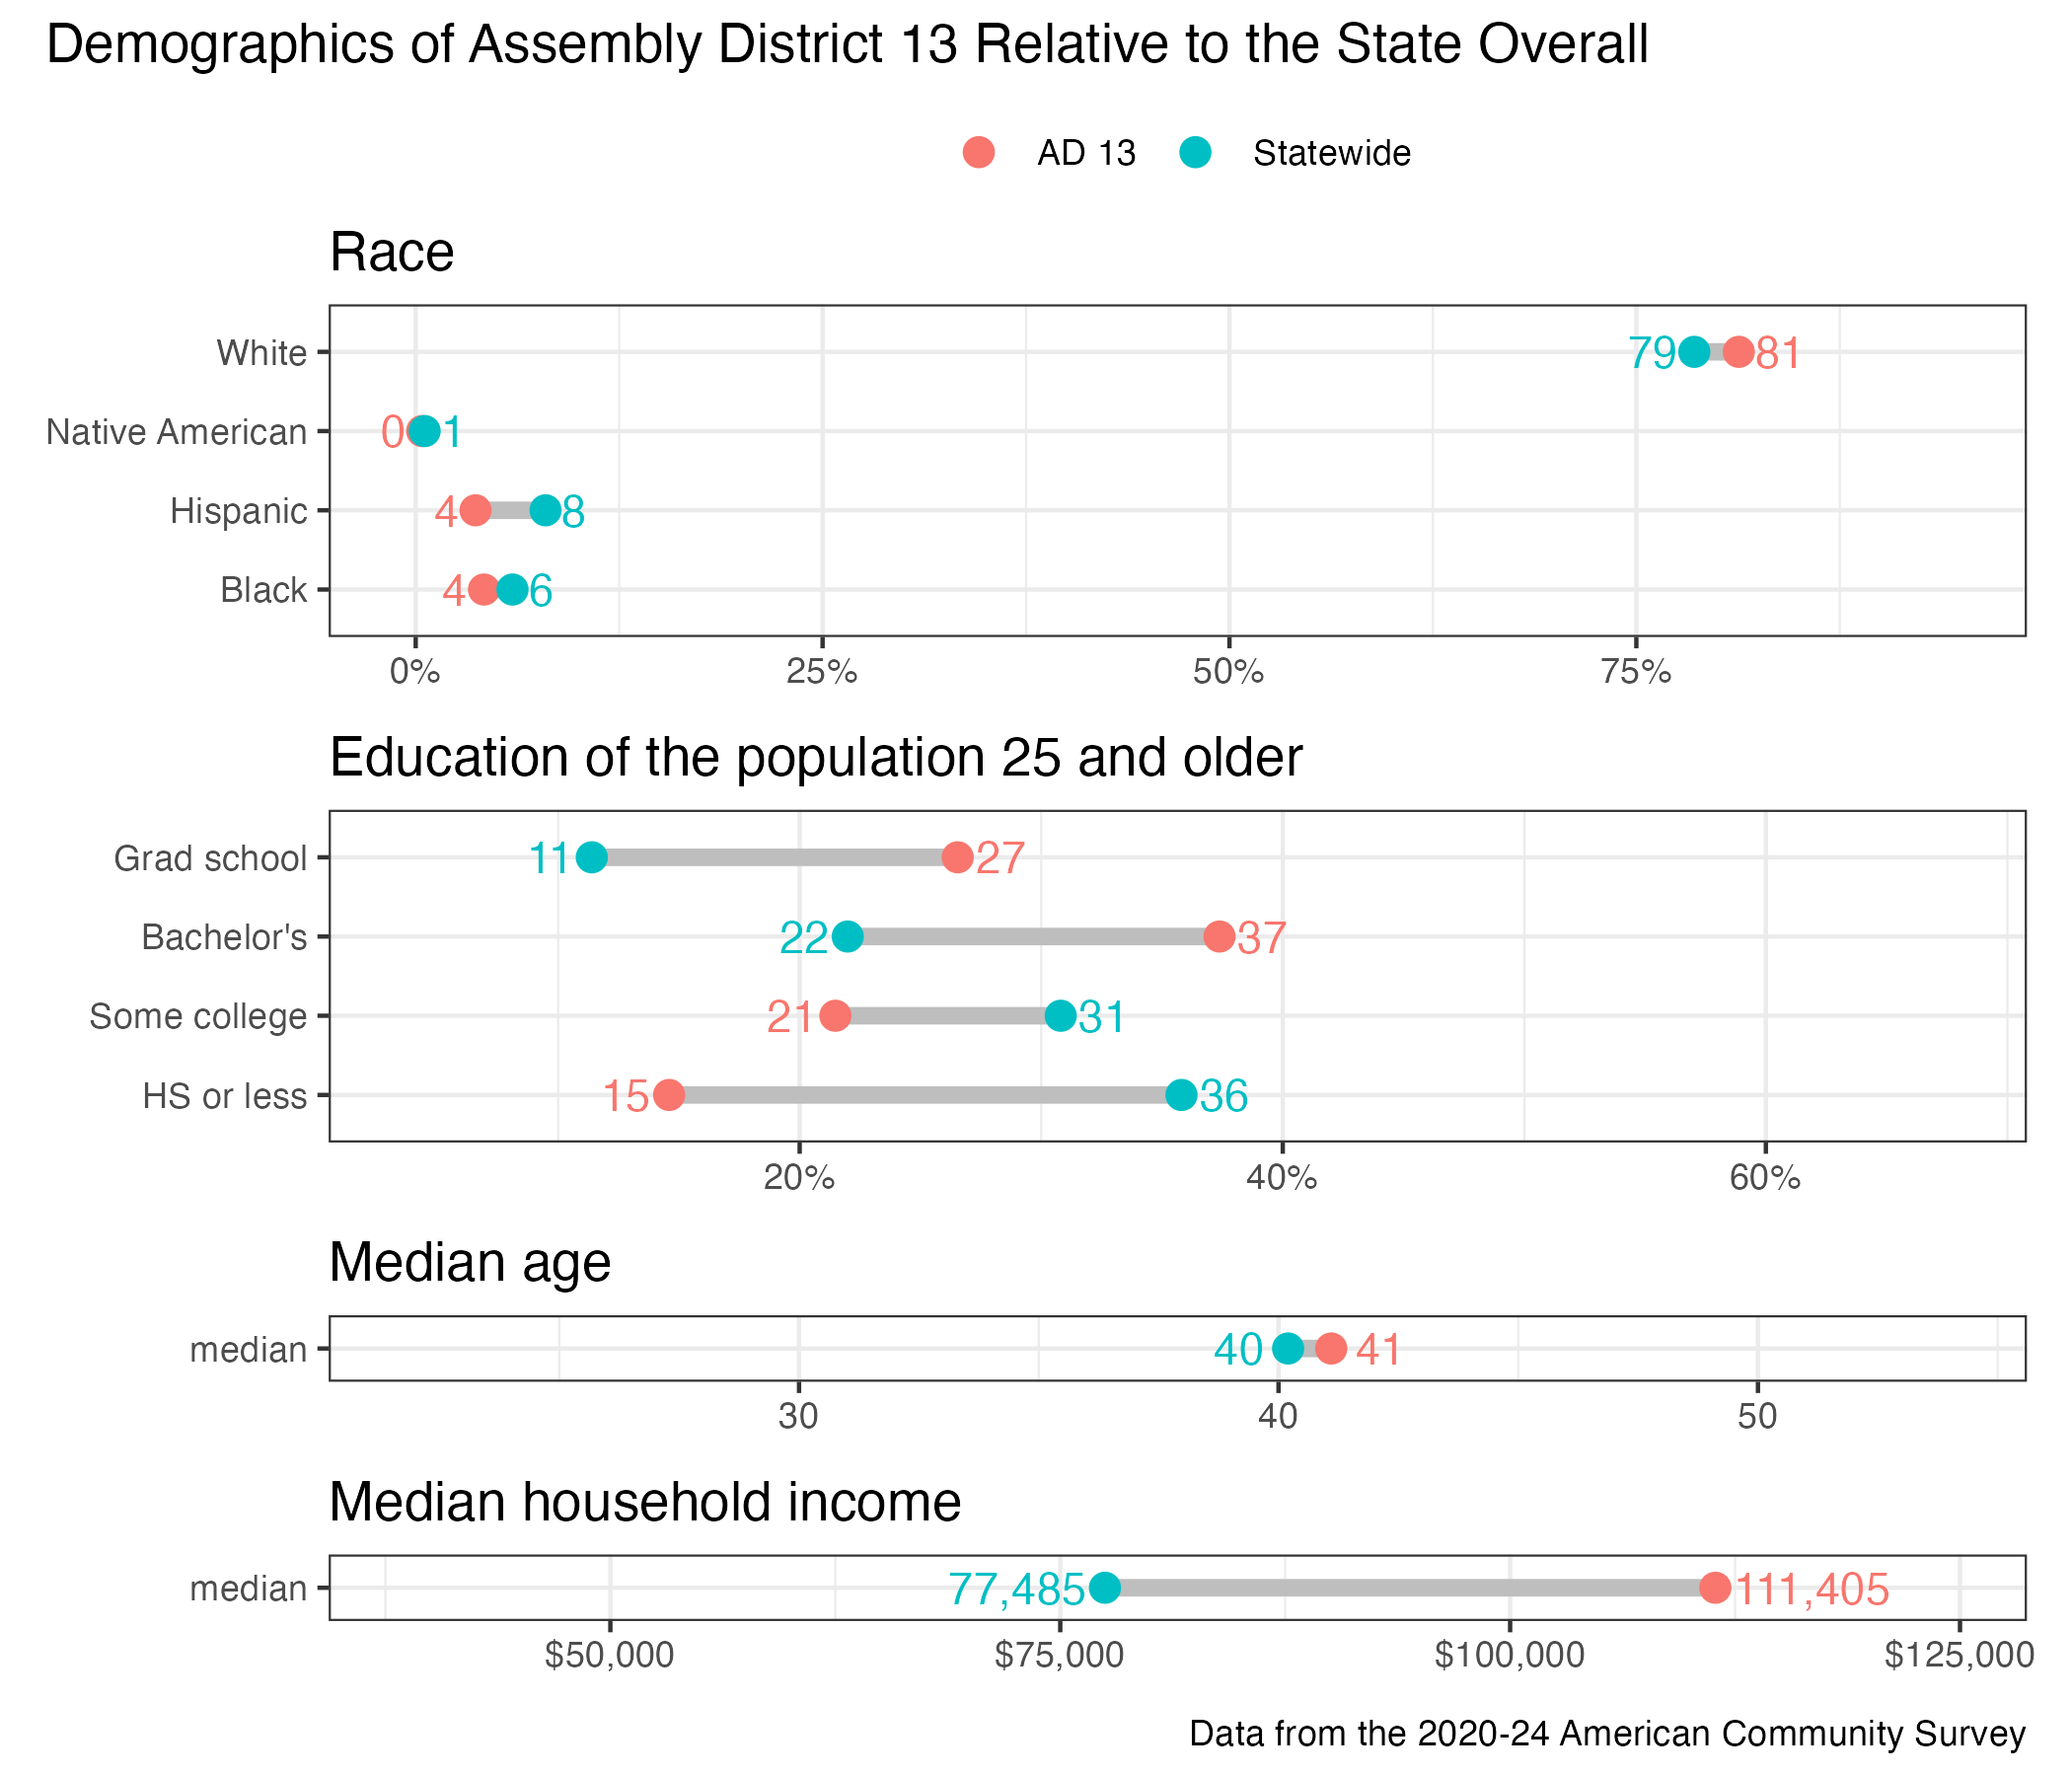
District demographics