33rd Assembly District
District
Candidates
| Assembly District 33 Candidates on the Primary Ballot | ||
| Incumbent: Robin J. Vos (Filed Notification of Noncandidacy) | ||
Jan 1 thru July 30
|
||
|---|---|---|
| receipts | disbursements | |
| Republican | ||
| Rick Stacey | $3,295.00 | $822.35 |
| Steve Wicklund | $30,998.86 | $10,512.30 |
| Democratic | ||
| Maria Elena Bisabarros | $887.75 | $0.00 |
| Rick Bailey | $2,737.00 | $286.85 |
| Data from the 2026 July Continuing Report. Any amended reports might not yet be shown. | ||
Past election results
| Election Results in Wisconsin State Assembly District 33 | ||||||
votes
|
Dem. %1 |
margin (Dem. - Rep.)
|
||||
|---|---|---|---|---|---|---|
| total | Dem. | Rep. | votes | points2 | ||
| 2016 President | 30,717 | 9,834 | 19,007 | 34.1% | −9,173 | −31.8 |
| 2016 Senator | 30,580 | 9,653 | 20,044 | 32.5% | −10,391 | −35.0 |
| 2018 Governor | 28,327 | 9,597 | 18,158 | 34.6% | −8,561 | −30.8 |
| 2018 Senator | 28,139 | 11,251 | 16,837 | 40.1% | −5,586 | −19.9 |
| 2020 President | 35,662 | 12,544 | 22,508 | 35.8% | −9,964 | −28.4 |
| 2022 Governor | 28,926 | 10,398 | 18,156 | 36.4% | −7,758 | −27.2 |
| 2022 Senator | 28,923 | 9,890 | 18,929 | 34.3% | −9,039 | −31.4 |
| 2024 President | 36,851 | 12,720 | 23,583 | 35.0% | −10,863 | −29.9 |
| 2024 Senator | 36,559 | 12,624 | 23,142 | 35.3% | −10,518 | −29.4 |
| 2024 WI Assembly | 36,083 | 10,739 | 20,555 | 34.3% | −9,816 | −31.4 |
| 2025 WI Sup. Ct.3 | 26,051 | 10,327 | 15,702 | 39.7% | −5,375 | −20.7 |
| 1 Share of the two-party vote. For Rep. share, subtract from 100. | ||||||
| 2 Dem % of the two-party vote minus Rep % of the two-party vote | ||||||
| 3 Formally nonpartisan candidates assigned party labels based on state endorsements | ||||||
| Election results allocated into 2024 district boundaries based on population overlap. Calculations by John Johnson (johndjohnson.info). | ||||||
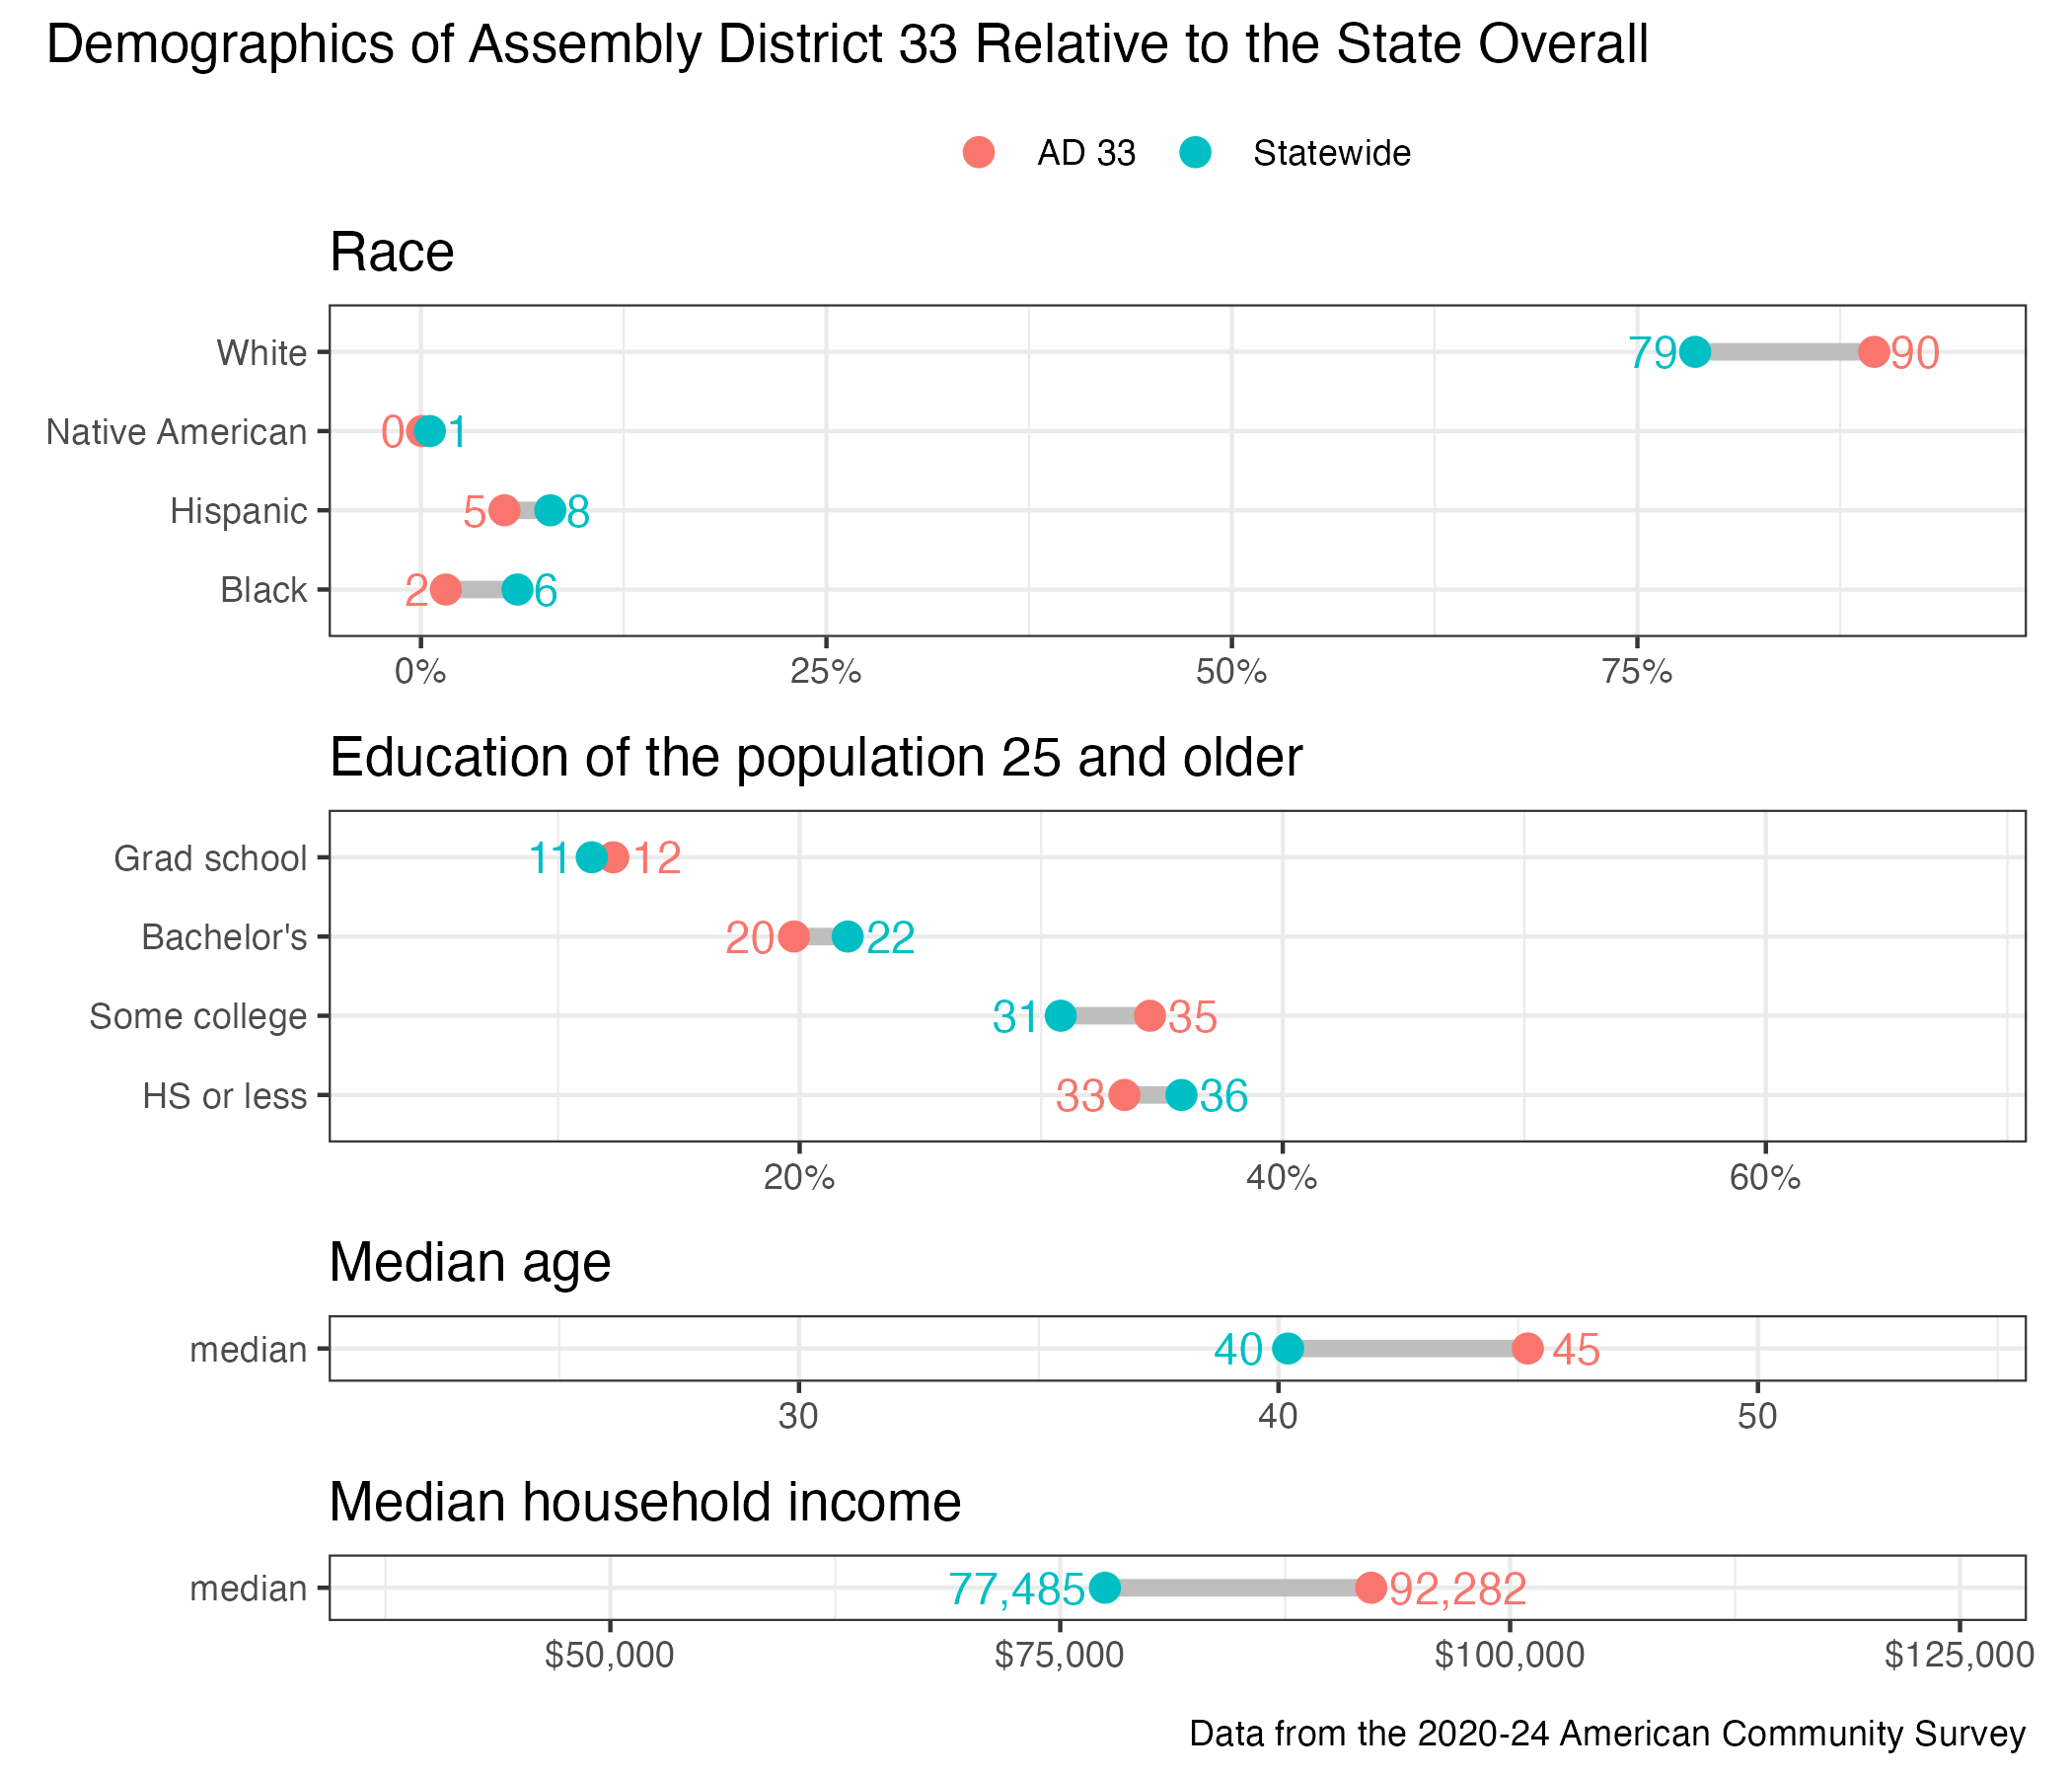
District demographics