66th Assembly District
District
Candidates
| Assembly District 66 Candidates on the Primary Ballot | ||
| Incumbent: Greta Neubauer | ||
Jan 1 thru July 30
|
||
|---|---|---|
| receipts | disbursements | |
| Republican | ||
| Gina Cefalu Paulick | $36,228.90 | $11,738.44 |
| Democratic | ||
| Greta Neubauer | $32,685.75 | $5,136.73 |
| Data from the 2026 July Continuing Report. Any amended reports might not yet be shown. | ||
Past election results
| Election Results in Wisconsin State Assembly District 66 | ||||||
votes
|
Dem. %1 |
margin (Dem. - Rep.)
|
||||
|---|---|---|---|---|---|---|
| total | Dem. | Rep. | votes | points2 | ||
| 2016 President | 26,849 | 14,288 | 11,120 | 56.2% | +3,168 | +12.5 |
| 2016 Senator | 26,593 | 13,894 | 11,986 | 53.7% | +1,908 | +7.4 |
| 2018 Governor | 24,740 | 13,553 | 10,627 | 56.1% | +2,926 | +12.1 |
| 2018 Senator | 24,643 | 14,912 | 9,689 | 60.6% | +5,223 | +21.2 |
| 2020 President | 30,192 | 16,575 | 13,108 | 55.8% | +3,467 | +11.7 |
| 2022 Governor | 22,573 | 12,542 | 9,756 | 56.2% | +2,786 | +12.5 |
| 2022 Senator | 22,622 | 12,288 | 10,276 | 54.5% | +2,012 | +8.9 |
| 2024 President | 30,496 | 16,432 | 13,573 | 54.8% | +2,859 | +9.5 |
| 2024 Senator | 30,166 | 16,344 | 13,036 | 55.6% | +3,308 | +11.3 |
| 2024 WI Assembly | 29,262 | 15,769 | 13,426 | 54.0% | +2,343 | +8.0 |
| 2025 WI Sup. Ct.3 | 20,153 | 11,941 | 8,195 | 59.3% | +3,746 | +18.6 |
| 1 Share of the two-party vote. For Rep. share, subtract from 100. | ||||||
| 2 Dem % of the two-party vote minus Rep % of the two-party vote | ||||||
| 3 Formally nonpartisan candidates assigned party labels based on state endorsements | ||||||
| Election results allocated into 2024 district boundaries based on population overlap. Calculations by John Johnson (johndjohnson.info). | ||||||
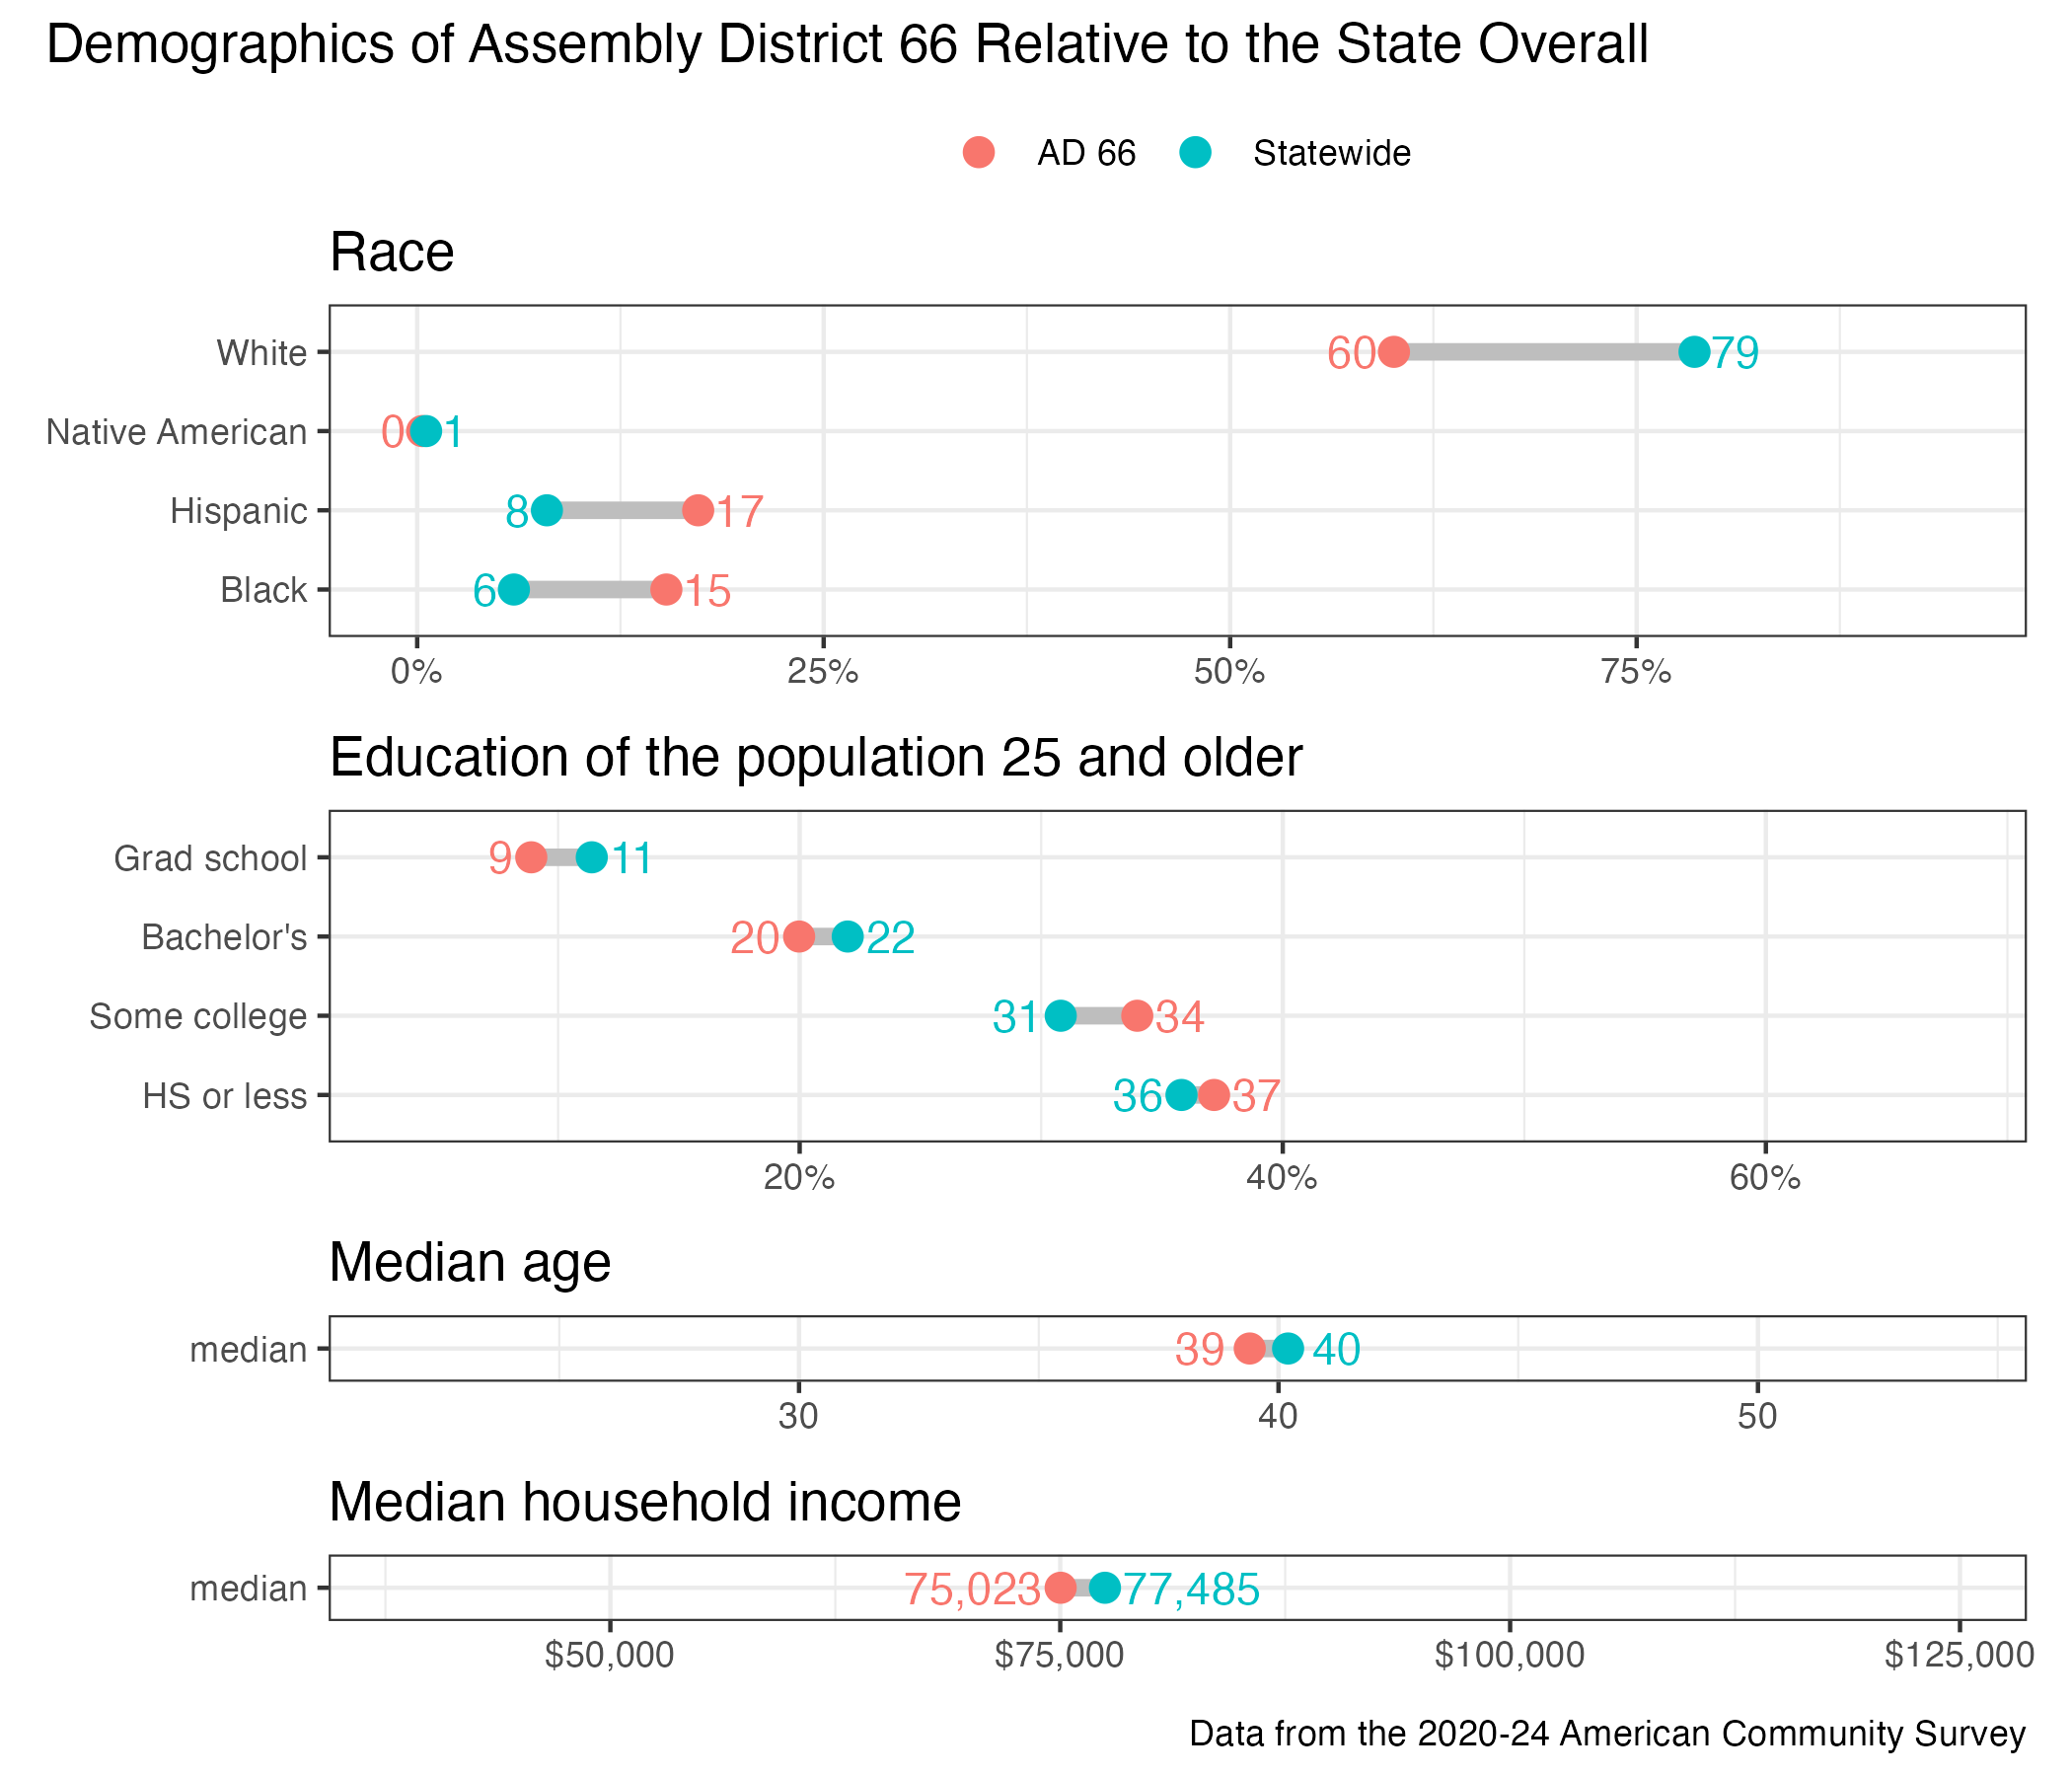
District demographics