33rd Senate District
District
Candidates
| Senate District 33 Candidates on the Primary Ballot | ||
| Incumbent: Chris Kapenga | ||
Jan 1 thru July 30
|
||
|---|---|---|
| receipts | disbursements | |
| Republican | ||
| Chris Kapenga | $9,000.30 | $6,210.64 |
| Democratic | ||
| Mike Van Someren | $24,280.00 | $7,444.38 |
| Data from the 2026 July Continuing Report. Any amended reports might not yet be shown. | ||
Past election results
| Election Results in Wisconsin State Senate District 33 | ||||||
votes
|
Dem. %1 |
margin (Dem. - Rep.)
|
||||
|---|---|---|---|---|---|---|
| total | Dem. | Rep. | votes | points2 | ||
| 2016 President | 105,139 | 29,161 | 69,518 | 29.6% | −40,357 | −40.9 |
| 2016 Senator | 105,447 | 26,746 | 76,677 | 25.9% | −49,931 | −48.3 |
| 2018 Governor | 98,347 | 26,694 | 70,443 | 27.5% | −43,749 | −45.0 |
| 2018 Senator | 97,790 | 31,811 | 65,889 | 32.6% | −34,078 | −34.9 |
| 2020 President | 121,033 | 38,883 | 80,343 | 32.6% | −41,460 | −34.8 |
| 2022 Governor | 102,943 | 33,405 | 68,720 | 32.7% | −35,315 | −34.6 |
| 2022 Senator | 102,752 | 31,417 | 71,161 | 30.6% | −39,744 | −38.7 |
| 2024 President | 126,425 | 41,050 | 83,533 | 32.9% | −42,483 | −34.1 |
| 2024 Senator | 125,526 | 39,956 | 83,639 | 32.3% | −43,683 | −35.3 |
| 2024 NA | NA | NA | NA | NA | NA | NA |
| 2025 WI Sup. Ct.3 | 92,607 | 32,250 | 60,316 | 34.8% | −28,066 | −30.3 |
| 1 Share of the two-party vote. For Rep. share, subtract from 100. | ||||||
| 2 Dem % of the two-party vote minus Rep % of the two-party vote | ||||||
| 3 Formally nonpartisan candidates assigned party labels based on state endorsements | ||||||
| Election results allocated into 2024 district boundaries based on population overlap. Calculations by John Johnson (johndjohnson.info). | ||||||
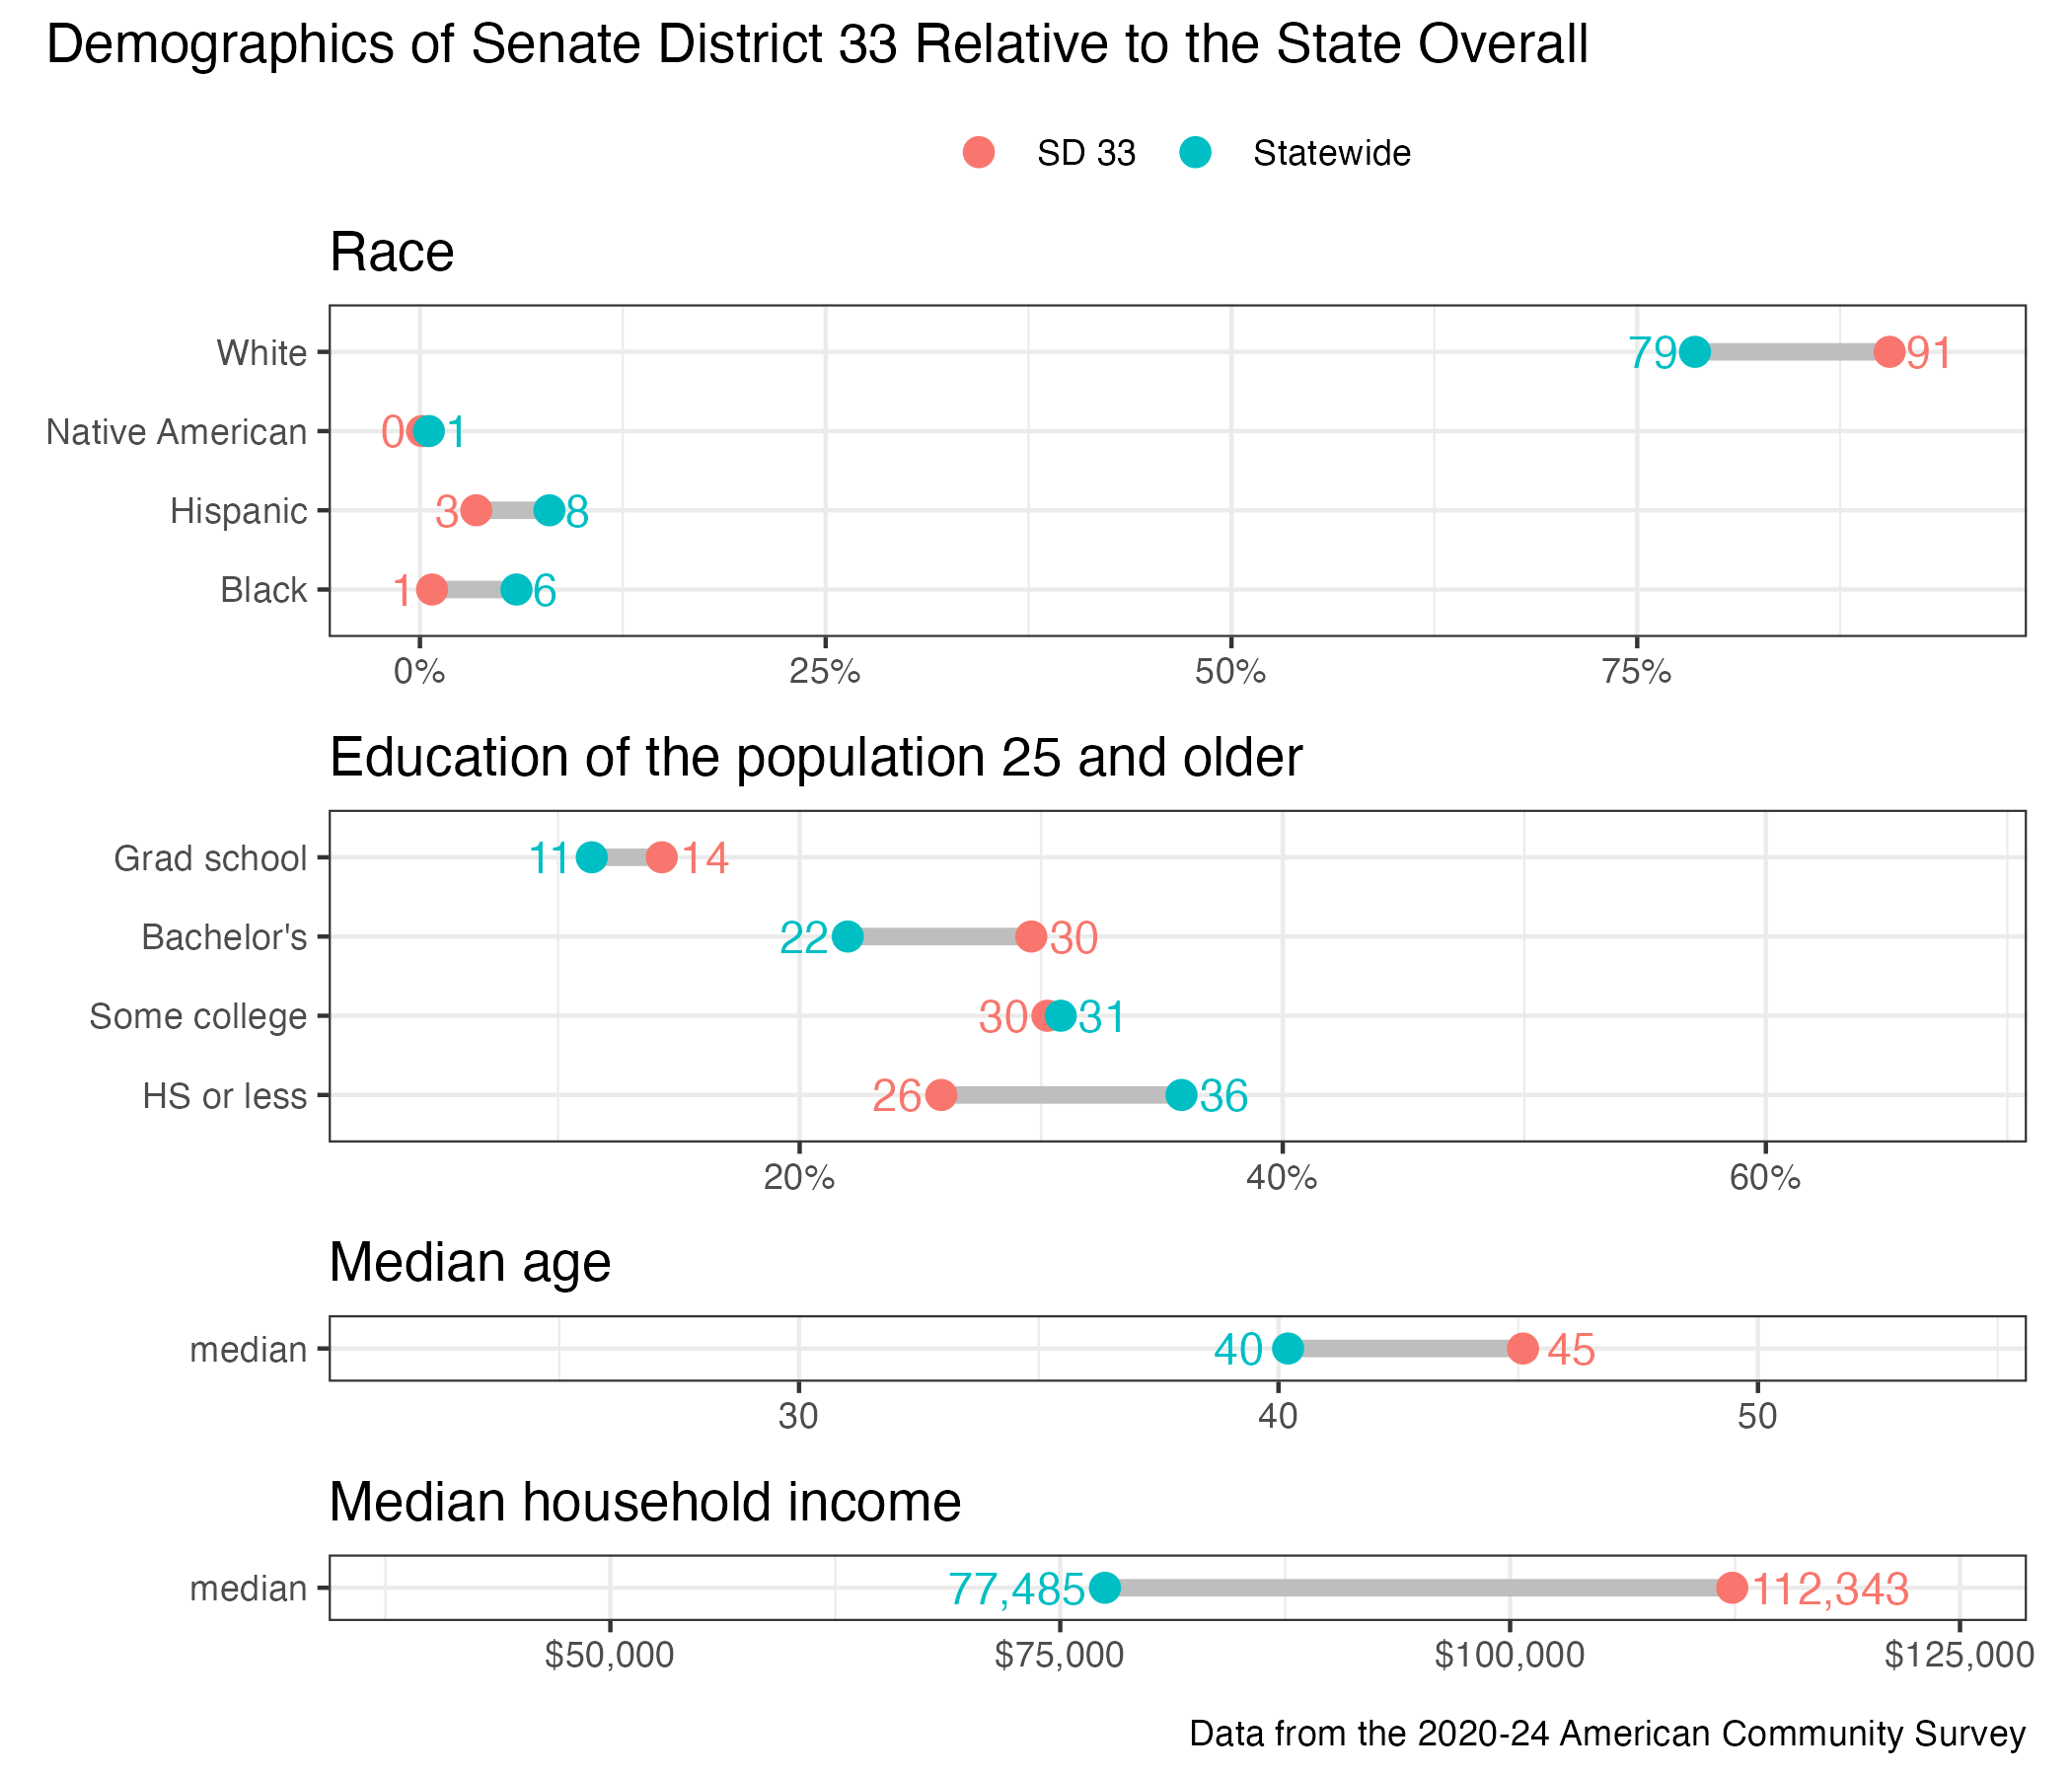
District demographics