81st Assembly District
District
Candidates
| Assembly District 81 Candidates on the Primary Ballot | ||
| Incumbent: Alex Joers | ||
Jan 1 thru July 30
|
||
|---|---|---|
| receipts | disbursements | |
| Republican | ||
| Mark S. Maier | $3,660.00 | $0.00 |
| Democratic | ||
| Alex Joers | $18,575.26 | $14,565.67 |
| Data from the 2026 July Continuing Report. Any amended reports might not yet be shown. | ||
Past election results
| Election Results in Wisconsin State Assembly District 81 | ||||||
votes
|
Dem. %1 |
margin (Dem. - Rep.)
|
||||
|---|---|---|---|---|---|---|
| total | Dem. | Rep. | votes | points2 | ||
| 2016 President | 33,728 | 21,392 | 10,199 | 67.7% | +11,193 | +35.4 |
| 2016 Senator | 33,709 | 22,063 | 11,107 | 66.5% | +10,956 | +33.0 |
| 2018 Governor | 32,818 | 22,175 | 10,147 | 68.6% | +12,028 | +37.2 |
| 2018 Senator | 32,743 | 23,276 | 9,424 | 71.2% | +13,852 | +42.4 |
| 2020 President | 39,295 | 26,905 | 11,709 | 69.7% | +15,196 | +39.4 |
| 2022 Governor | 34,290 | 24,530 | 9,472 | 72.1% | +15,058 | +44.3 |
| 2022 Senator | 34,204 | 23,713 | 10,399 | 69.5% | +13,314 | +39.0 |
| 2024 President | 41,077 | 28,184 | 12,234 | 69.7% | +15,950 | +39.5 |
| 2024 Senator | 40,884 | 28,043 | 12,327 | 69.5% | +15,716 | +38.9 |
| 2024 WI Assembly | 31,686 | 30,969 | 0 | 100.0% | +30,969 | +100.0 |
| 2025 WI Sup. Ct.3 | 32,156 | 24,086 | 8,055 | 74.9% | +16,031 | +49.9 |
| 1 Share of the two-party vote. For Rep. share, subtract from 100. | ||||||
| 2 Dem % of the two-party vote minus Rep % of the two-party vote | ||||||
| 3 Formally nonpartisan candidates assigned party labels based on state endorsements | ||||||
| Election results allocated into 2024 district boundaries based on population overlap. Calculations by John Johnson (johndjohnson.info). | ||||||
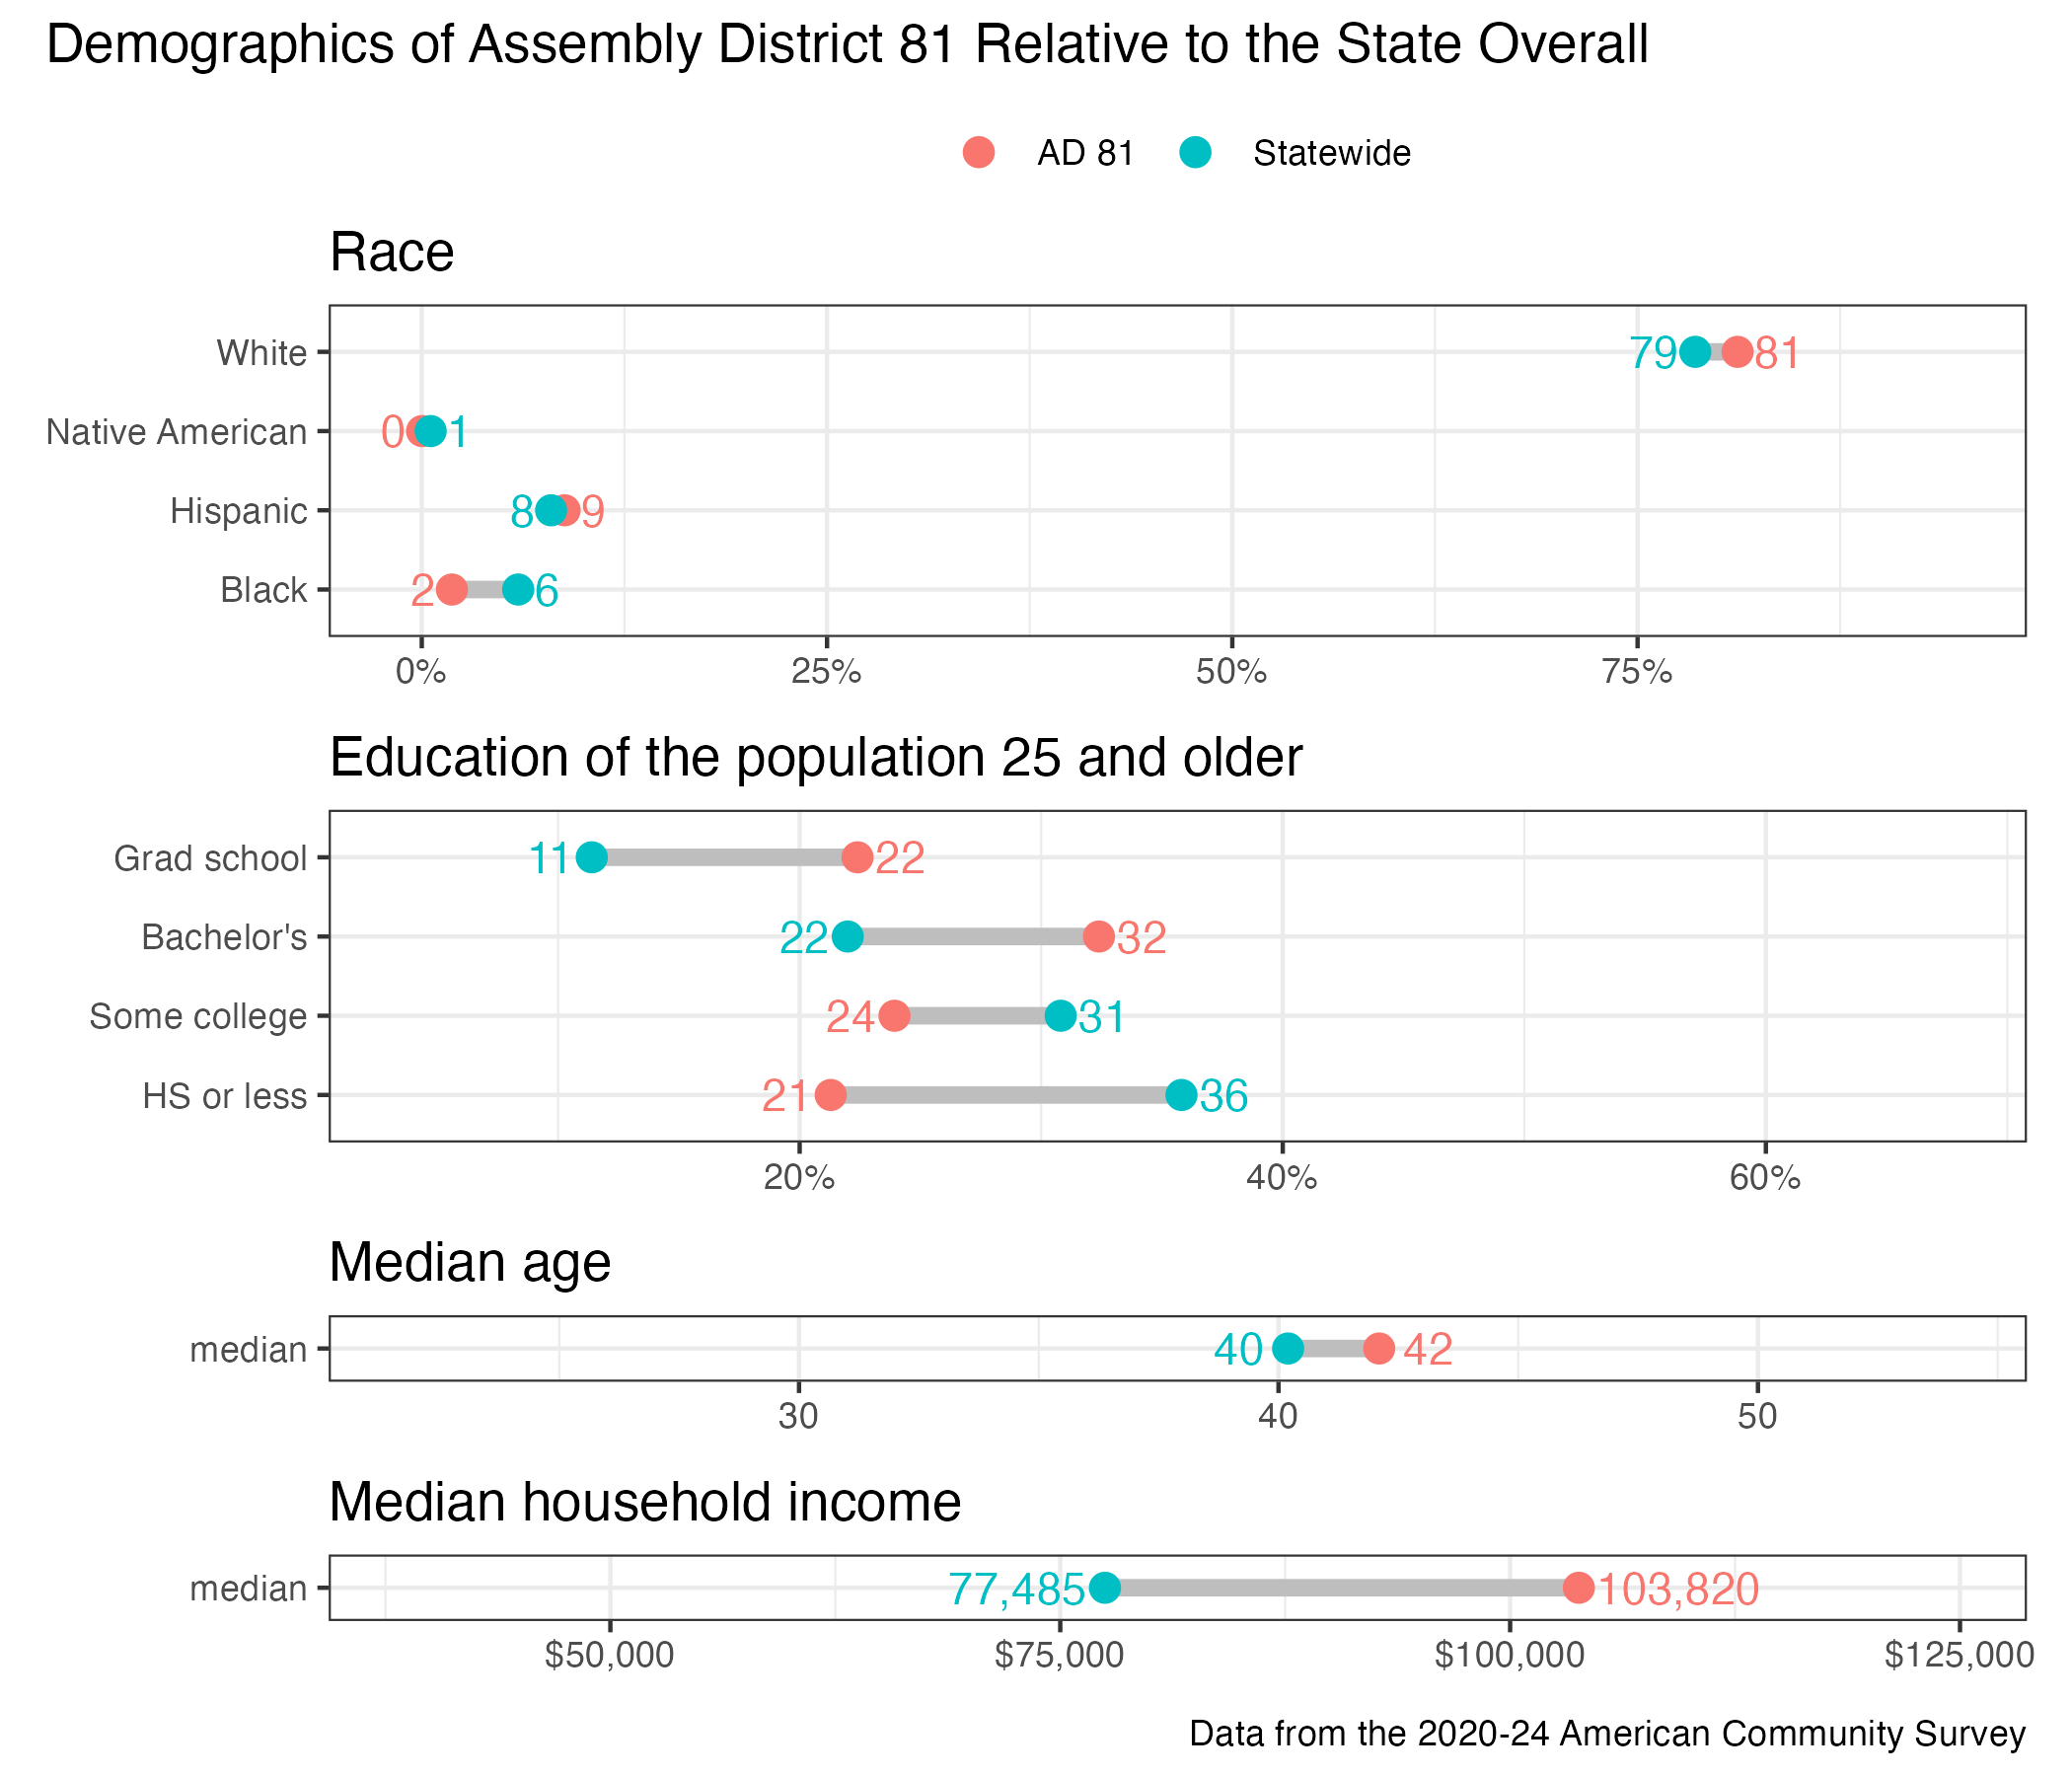
District demographics