96th Assembly District
District
Candidates
| Assembly District 96 Candidates on the Primary Ballot | ||
| Incumbent: Tara Johnson | ||
Jan 1 thru July 30
|
||
|---|---|---|
| receipts | disbursements | |
| Republican | ||
| Jim Green | $2,165.00 | $781.84 |
| Democratic | ||
| Tara Johnson | $46,217.00 | $25,723.61 |
| Data from the 2026 July Continuing Report. Any amended reports might not yet be shown. | ||
Past election results
| Election Results in Wisconsin State Assembly District 96 | ||||||
votes
|
Dem. %1 |
margin (Dem. - Rep.)
|
||||
|---|---|---|---|---|---|---|
| total | Dem. | Rep. | votes | points2 | ||
| 2016 President | 29,146 | 14,745 | 12,412 | 54.3% | +2,333 | +8.6 |
| 2016 Senator | 28,790 | 15,432 | 12,333 | 55.6% | +3,099 | +11.2 |
| 2018 Governor | 26,788 | 14,965 | 11,223 | 57.1% | +3,742 | +14.3 |
| 2018 Senator | 26,652 | 16,811 | 9,836 | 63.1% | +6,975 | +26.2 |
| 2020 President | 32,226 | 17,571 | 14,057 | 55.6% | +3,514 | +11.1 |
| 2022 Governor | 26,366 | 15,100 | 10,898 | 58.1% | +4,202 | +16.2 |
| 2022 Senator | 26,339 | 14,329 | 11,956 | 54.5% | +2,373 | +9.0 |
| 2024 President | 33,139 | 17,673 | 14,921 | 54.2% | +2,752 | +8.4 |
| 2024 Senator | 32,877 | 17,955 | 14,143 | 55.9% | +3,812 | +11.9 |
| 2024 WI Assembly | 32,595 | 16,615 | 15,963 | 51.0% | +652 | +2.0 |
| 2025 WI Sup. Ct.3 | 24,000 | 14,692 | 9,298 | 61.2% | +5,394 | +22.5 |
| 1 Share of the two-party vote. For Rep. share, subtract from 100. | ||||||
| 2 Dem % of the two-party vote minus Rep % of the two-party vote | ||||||
| 3 Formally nonpartisan candidates assigned party labels based on state endorsements | ||||||
| Election results allocated into 2024 district boundaries based on population overlap. Calculations by John Johnson (johndjohnson.info). | ||||||
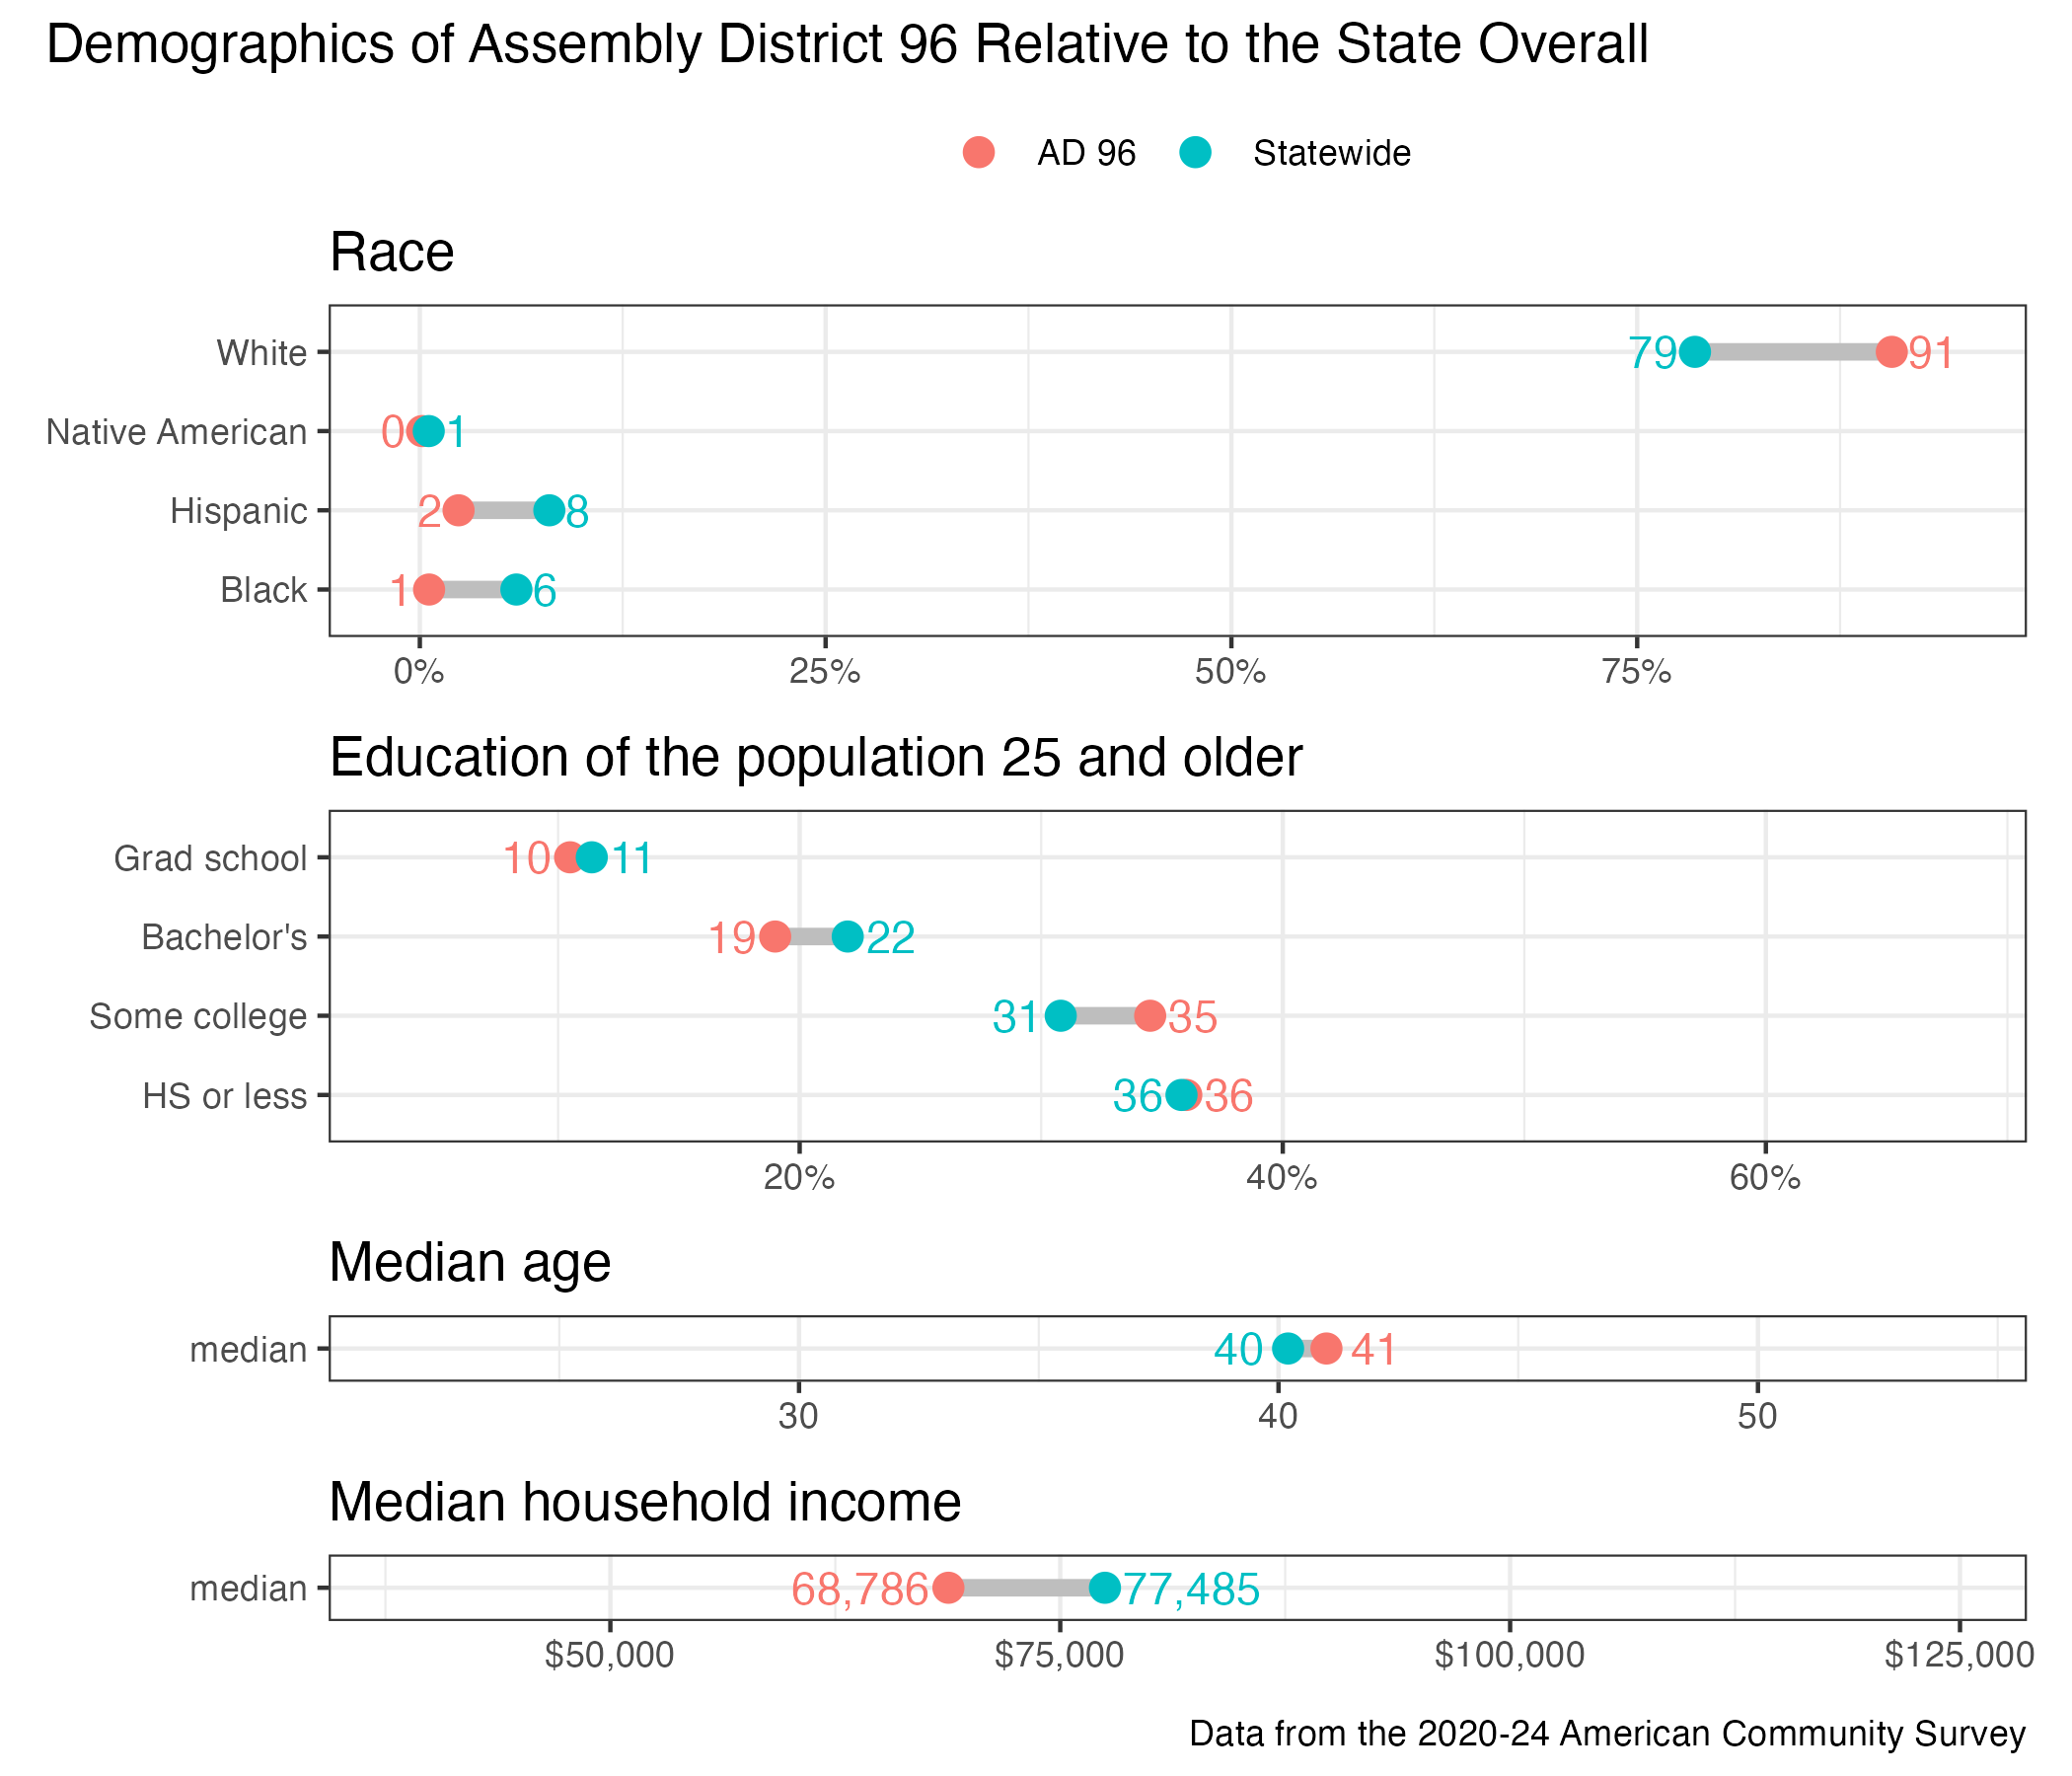
District demographics