84th Assembly District
District
Candidates
| Assembly District 84 Candidates on the Primary Ballot | ||
| Incumbent: Chuck Wichgers | ||
Jan 1 thru July 30
|
||
|---|---|---|
| receipts | disbursements | |
| Republican | ||
| Chuck Wichgers | $2,438.00 | $1,626.96 |
| Data from the 2026 July Continuing Report. Any amended reports might not yet be shown. | ||
Past election results
| Election Results in Wisconsin State Assembly District 84 | ||||||
votes
|
Dem. %1 |
margin (Dem. - Rep.)
|
||||
|---|---|---|---|---|---|---|
| total | Dem. | Rep. | votes | points2 | ||
| 2016 President | 34,750 | 9,481 | 23,470 | 28.8% | −13,989 | −42.5 |
| 2016 Senator | 34,721 | 8,992 | 25,104 | 26.4% | −16,112 | −47.3 |
| 2018 Governor | 32,231 | 8,786 | 23,024 | 27.6% | −14,238 | −44.8 |
| 2018 Senator | 32,068 | 10,469 | 21,557 | 32.7% | −11,088 | −34.6 |
| 2020 President | 39,774 | 11,956 | 27,278 | 30.5% | −15,322 | −39.1 |
| 2022 Governor | 33,193 | 10,194 | 22,731 | 31.0% | −12,537 | −38.1 |
| 2022 Senator | 33,131 | 9,579 | 23,481 | 29.0% | −13,902 | −42.1 |
| 2024 President | 41,298 | 12,512 | 28,252 | 30.7% | −15,740 | −38.6 |
| 2024 Senator | 40,925 | 12,255 | 28,000 | 30.4% | −15,745 | −39.1 |
| 2024 WI Assembly | 39,895 | 11,174 | 28,676 | 28.0% | −17,502 | −43.9 |
| 2025 WI Sup. Ct.3 | 30,100 | 10,101 | 19,977 | 33.6% | −9,876 | −32.8 |
| 1 Share of the two-party vote. For Rep. share, subtract from 100. | ||||||
| 2 Dem % of the two-party vote minus Rep % of the two-party vote | ||||||
| 3 Formally nonpartisan candidates assigned party labels based on state endorsements | ||||||
| Election results allocated into 2024 district boundaries based on population overlap. Calculations by John Johnson (johndjohnson.info). | ||||||
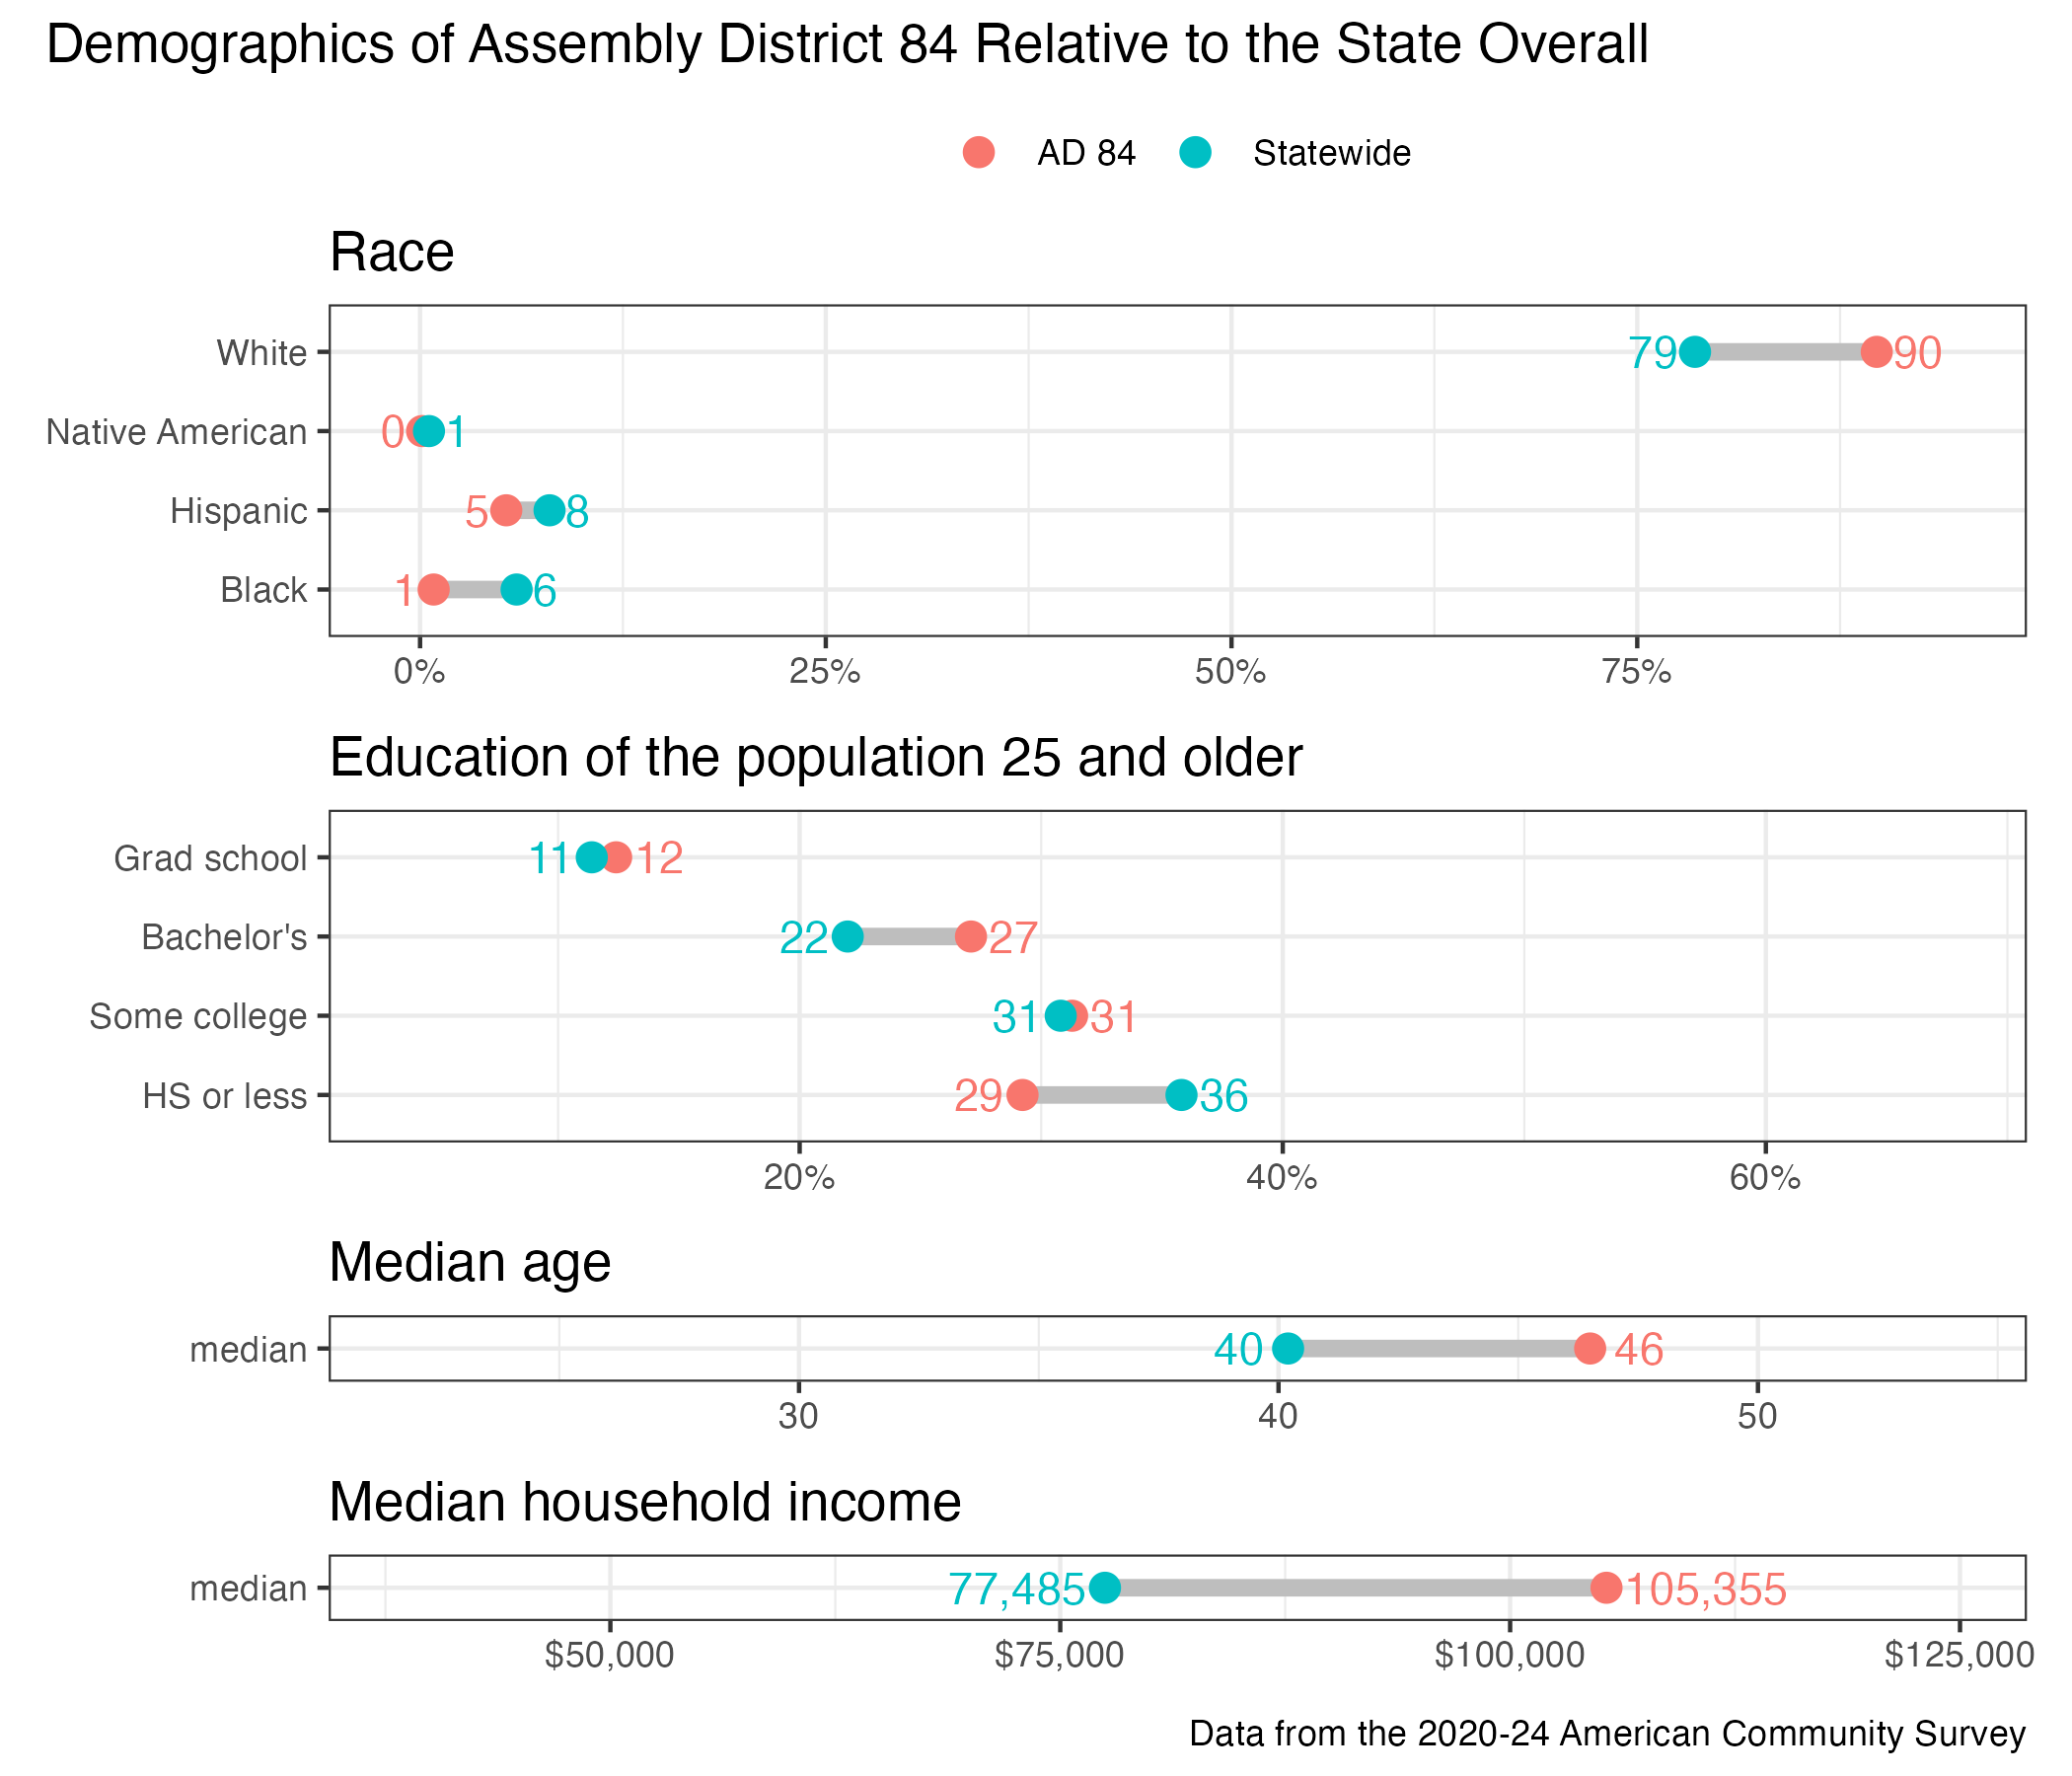
District demographics