21st Assembly District
District
Candidates
| Assembly District 21 Candidates on the Primary Ballot | ||
| Incumbent: Jessie Rodriguez (Filed Notification of Noncandidacy) | ||
Jan 1 thru July 30
|
||
|---|---|---|
| receipts | disbursements | |
| Republican | ||
| Dylan Pfaffenbach | $7,540.00 | $2,234.63 |
| Democratic | ||
| Daniel J. Bukiewicz | $79,251.88 | $16,601.61 |
| David Liners | $26,010.45 | $12,247.31 |
| Data from the 2026 July Continuing Report. Any amended reports might not yet be shown. | ||
Past election results
| Election Results in Wisconsin State Assembly District 21 | ||||||
votes
|
Dem. %1 |
margin (Dem. - Rep.)
|
||||
|---|---|---|---|---|---|---|
| total | Dem. | Rep. | votes | points2 | ||
| 2016 President | 29,501 | 13,838 | 13,770 | 50.1% | +68 | +0.2 |
| 2016 Senator | 29,103 | 13,416 | 14,984 | 47.2% | −1,568 | −5.5 |
| 2018 Governor | 26,967 | 13,271 | 13,195 | 50.1% | +76 | +0.3 |
| 2018 Senator | 26,804 | 14,830 | 11,917 | 55.4% | +2,913 | +10.9 |
| 2020 President | 33,243 | 17,082 | 15,541 | 52.4% | +1,541 | +4.7 |
| 2022 Governor | 25,815 | 13,986 | 11,566 | 54.7% | +2,420 | +9.5 |
| 2022 Senator | 25,783 | 13,557 | 12,163 | 52.7% | +1,394 | +5.4 |
| 2024 President | 34,227 | 17,363 | 15,978 | 52.1% | +1,385 | +4.2 |
| 2024 Senator | 33,677 | 17,571 | 15,224 | 53.6% | +2,347 | +7.2 |
| 2024 WI Assembly | 33,009 | 15,993 | 16,923 | 48.6% | −930 | −2.8 |
| 2025 WI Sup. Ct.3 | 22,575 | 13,456 | 9,097 | 59.7% | +4,359 | +19.3 |
| 1 Share of the two-party vote. For Rep. share, subtract from 100. | ||||||
| 2 Dem % of the two-party vote minus Rep % of the two-party vote | ||||||
| 3 Formally nonpartisan candidates assigned party labels based on state endorsements | ||||||
| Election results allocated into 2024 district boundaries based on population overlap. Calculations by John Johnson (johndjohnson.info). | ||||||
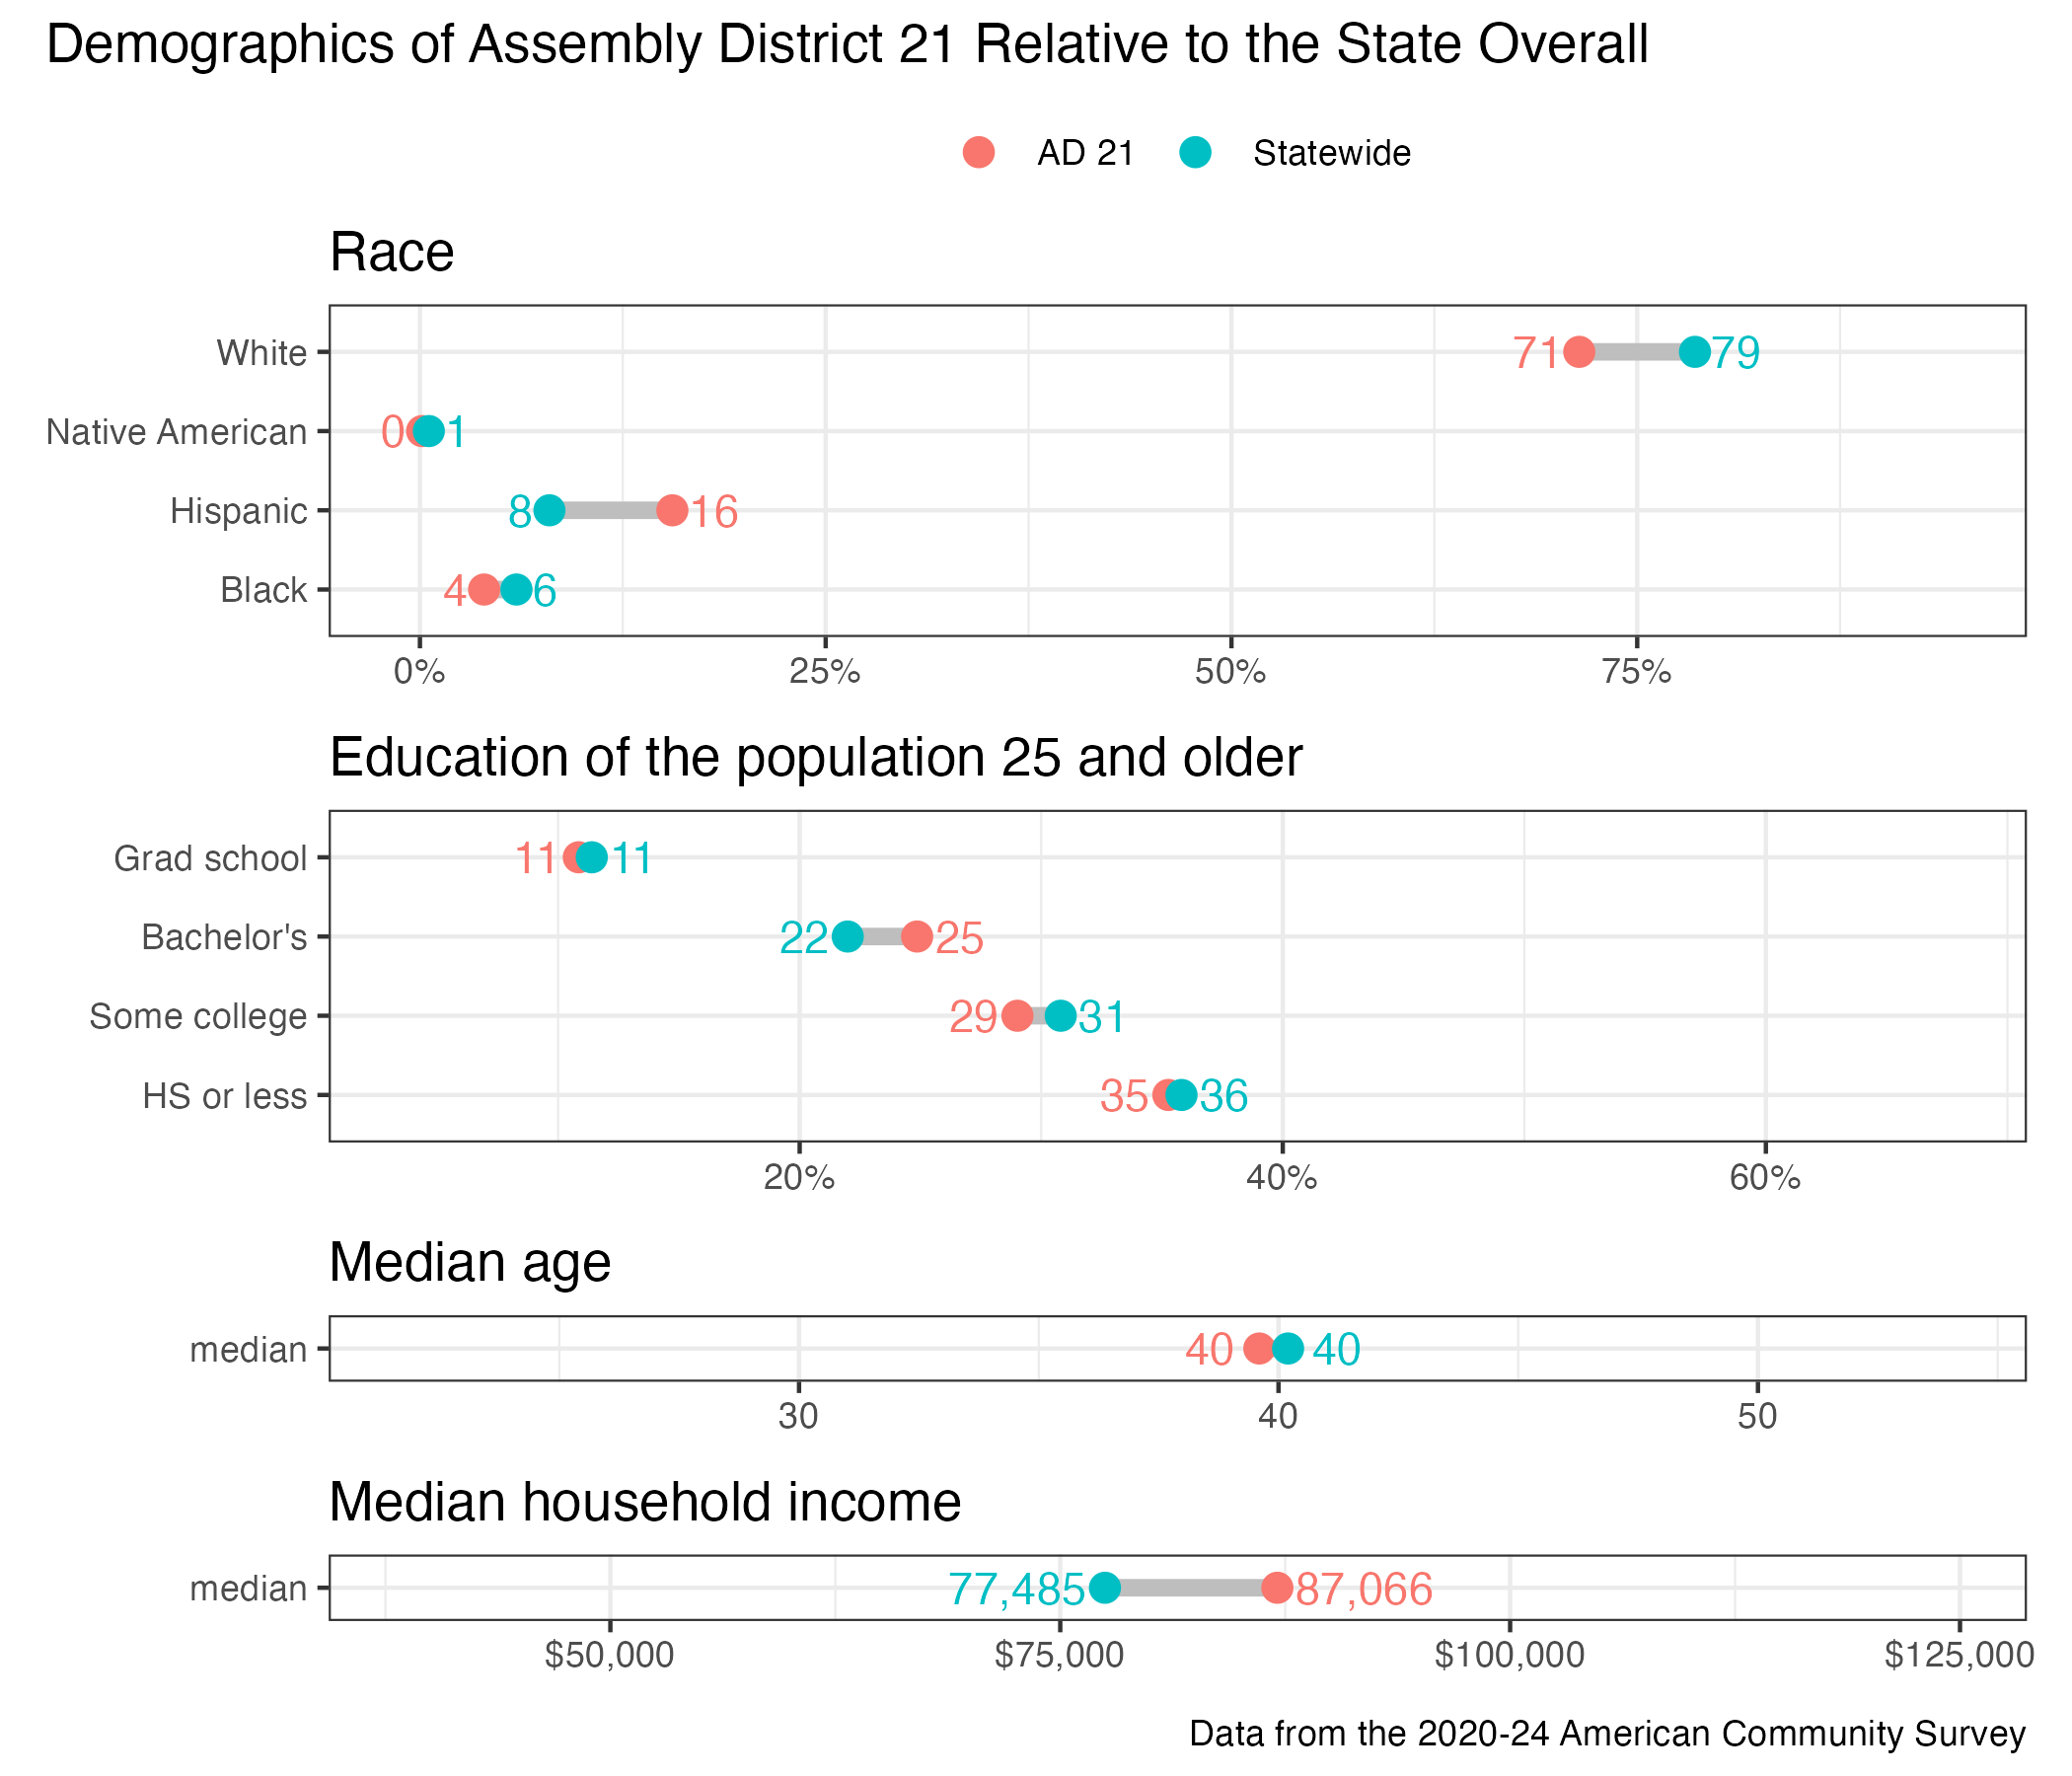
District demographics