35th Assembly District
District
Candidates
| Assembly District 35 Candidates on the Primary Ballot | ||
| Incumbent: Calvin Callahan | ||
Jan 1 thru July 30
|
||
|---|---|---|
| receipts | disbursements | |
| Republican | ||
| Calvin Callahan | $15,862.00 | $4,054.67 |
| Democratic | ||
| Elizabeth McCrank | $454.00 | $752.89 |
| Data from the 2026 July Continuing Report. Any amended reports might not yet be shown. | ||
Past election results
| Election Results in Wisconsin State Assembly District 35 | ||||||
votes
|
Dem. %1 |
margin (Dem. - Rep.)
|
||||
|---|---|---|---|---|---|---|
| total | Dem. | Rep. | votes | points2 | ||
| 2016 President | 31,930 | 10,900 | 19,322 | 36.1% | −8,422 | −27.9 |
| 2016 Senator | 31,421 | 11,621 | 18,367 | 38.8% | −6,746 | −22.5 |
| 2018 Governor | 29,145 | 10,201 | 17,757 | 36.5% | −7,556 | −27.0 |
| 2018 Senator | 28,836 | 13,004 | 15,816 | 45.1% | −2,812 | −9.8 |
| 2020 President | 35,523 | 12,453 | 22,627 | 35.5% | −10,174 | −29.0 |
| 2022 Governor | 29,341 | 10,325 | 18,579 | 35.7% | −8,254 | −28.6 |
| 2022 Senator | 29,230 | 9,738 | 19,456 | 33.4% | −9,718 | −33.3 |
| 2024 President | 37,223 | 12,696 | 24,019 | 34.6% | −11,323 | −30.8 |
| 2024 Senator | 36,950 | 13,105 | 22,999 | 36.3% | −9,894 | −27.4 |
| 2024 WI Assembly | 36,055 | 11,616 | 24,421 | 32.2% | −12,805 | −35.5 |
| 2025 WI Sup. Ct.3 | 24,492 | 9,516 | 14,967 | 38.9% | −5,451 | −22.3 |
| 1 Share of the two-party vote. For Rep. share, subtract from 100. | ||||||
| 2 Dem % of the two-party vote minus Rep % of the two-party vote | ||||||
| 3 Formally nonpartisan candidates assigned party labels based on state endorsements | ||||||
| Election results allocated into 2024 district boundaries based on population overlap. Calculations by John Johnson (johndjohnson.info). | ||||||
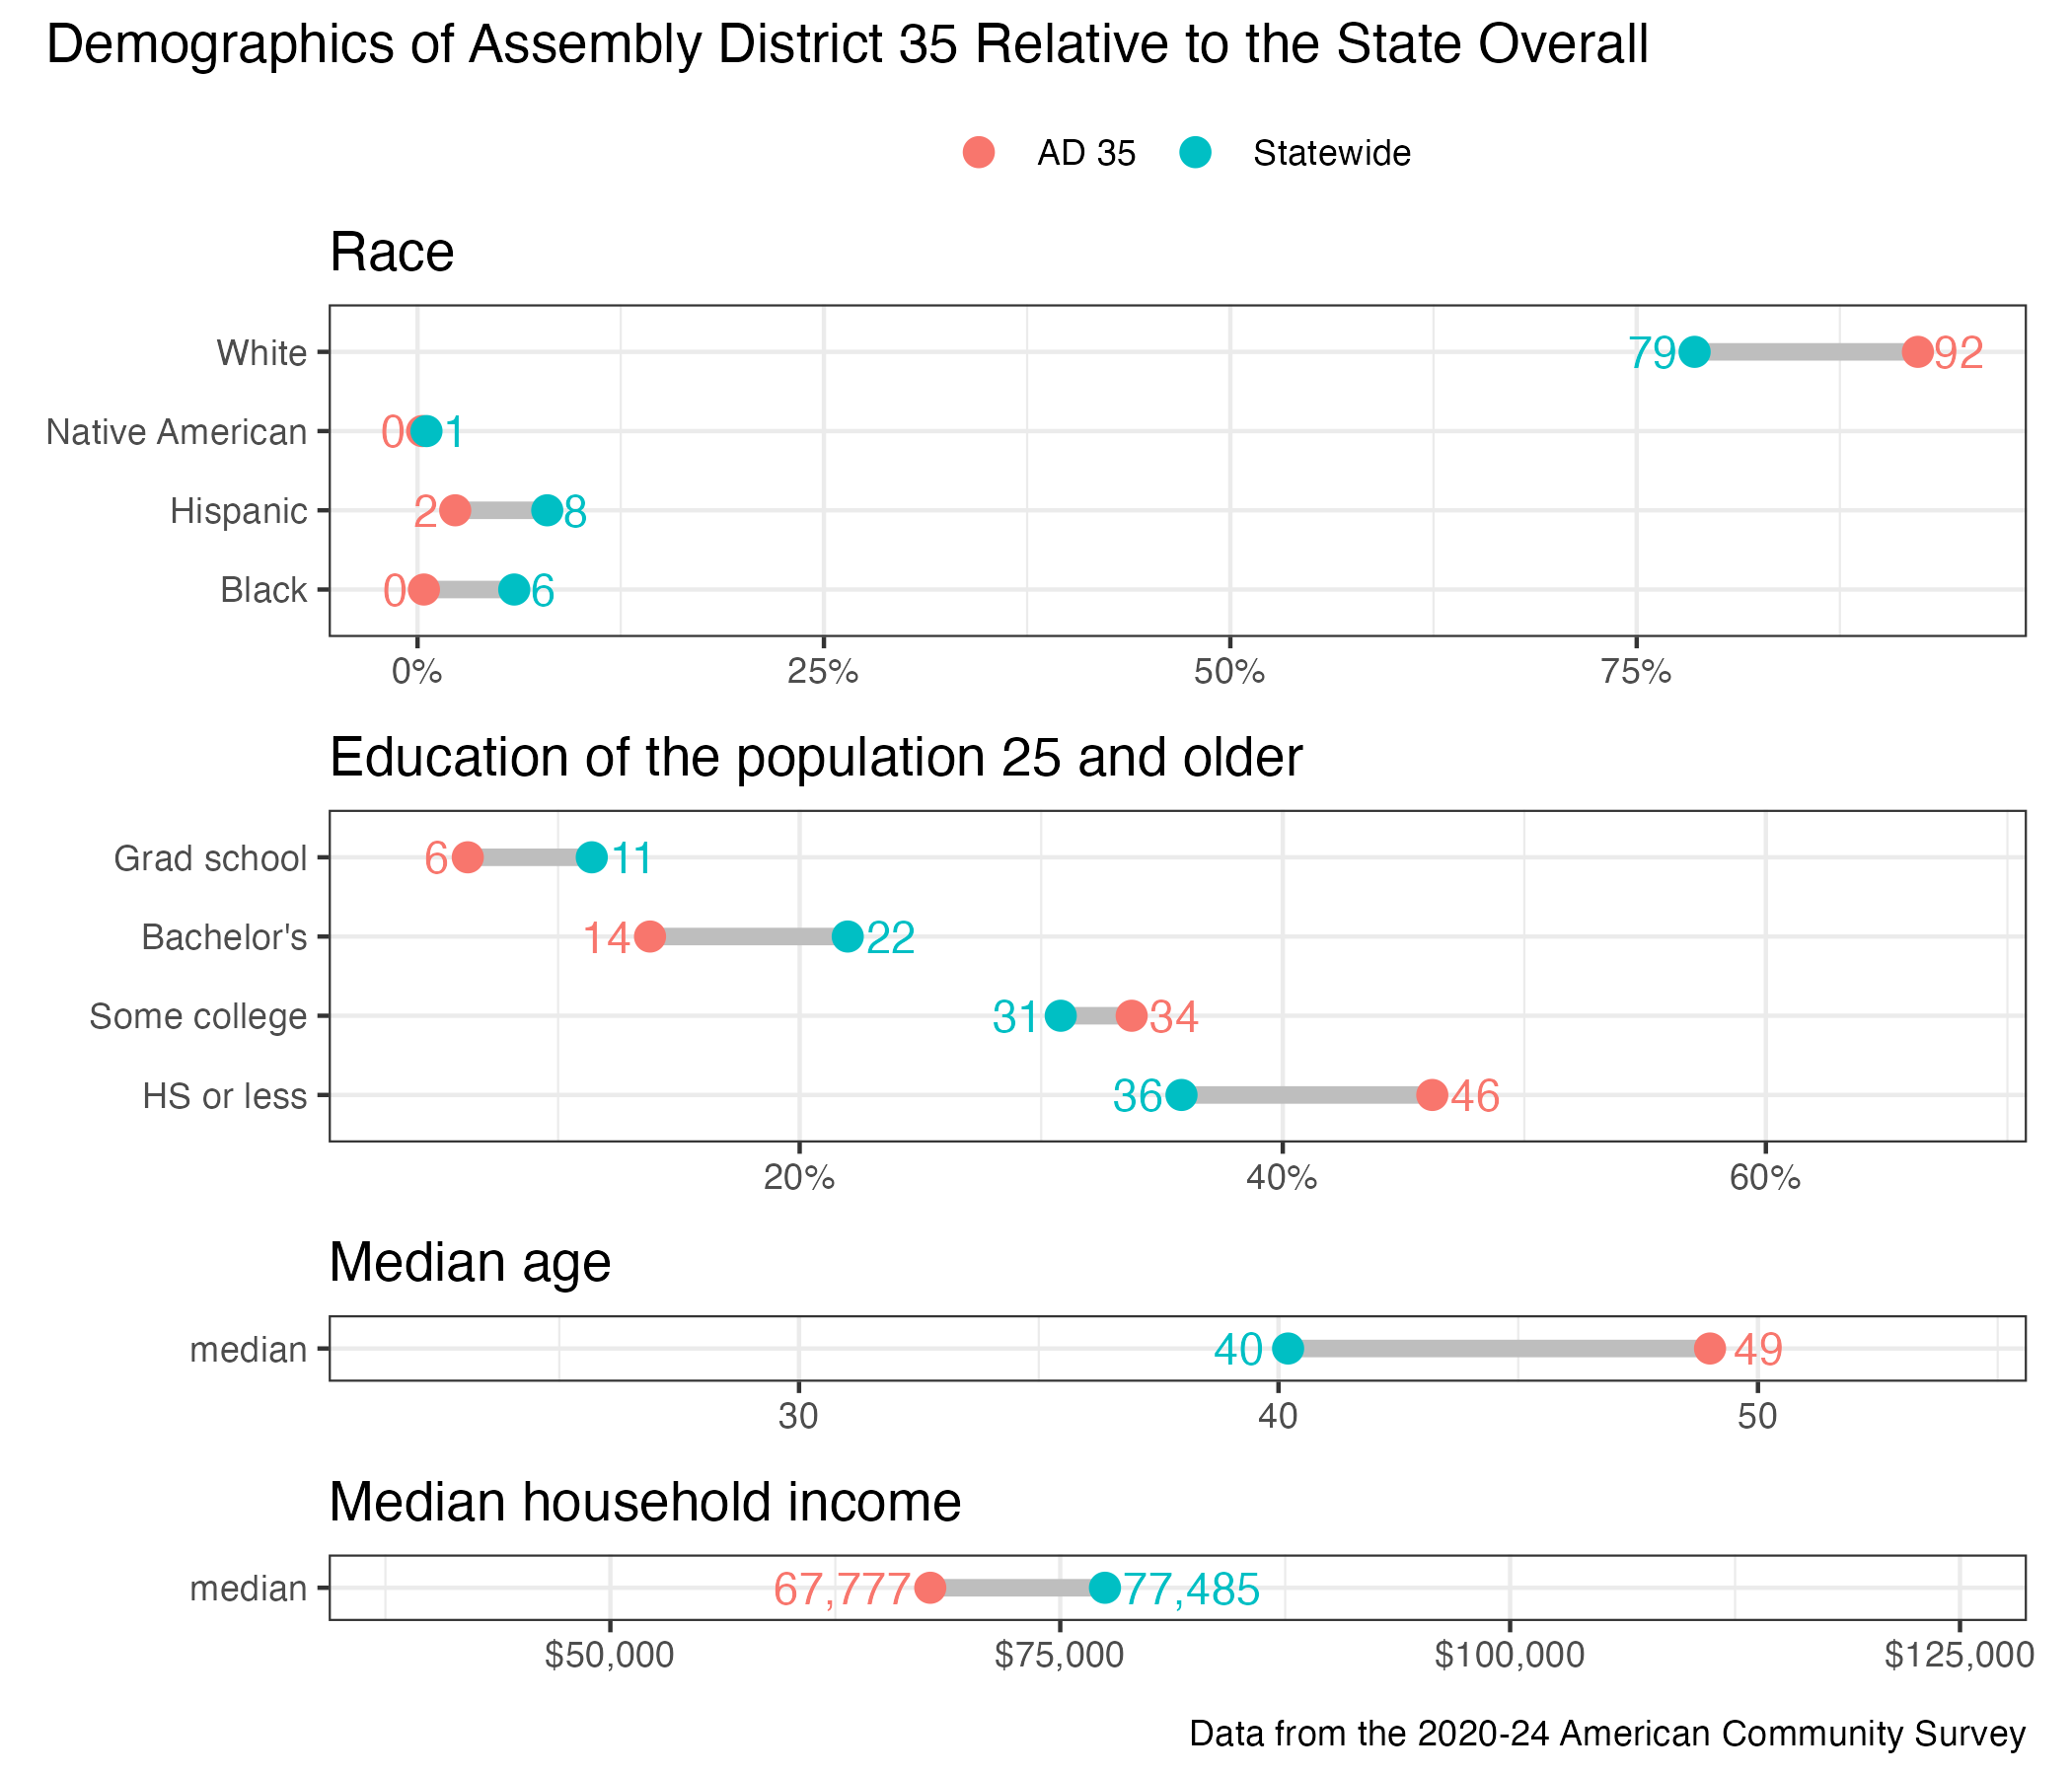
District demographics