17th Senate District
District
Candidates
| Senate District 17 Candidates on the Primary Ballot | ||
| Incumbent: Howard Marklein | ||
Jan 1 thru July 30
|
||
|---|---|---|
| receipts | disbursements | |
| Republican | ||
| Howard Marklein | $300,195.15 | $24,507.58 |
| Democratic | ||
| Jenna Jacobson | $109,277.66 | $21,988.58 |
| Corrine Hendrickson | $30,360.18 | $21,071.40 |
| Lisa Rose White | $7,641.00 | $9,573.76 |
| Data from the 2026 July Continuing Report. Any amended reports might not yet be shown. | ||
Past election results
| Election Results in Wisconsin State Senate District 17 | ||||||
votes
|
Dem. %1 |
margin (Dem. - Rep.)
|
||||
|---|---|---|---|---|---|---|
| total | Dem. | Rep. | votes | points2 | ||
| 2016 President | 89,490 | 43,994 | 39,449 | 52.7% | +4,545 | +5.4 |
| 2016 Senator | 88,653 | 47,732 | 38,486 | 55.4% | +9,246 | +10.7 |
| 2018 Governor | 78,951 | 44,029 | 33,303 | 56.9% | +10,726 | +13.9 |
| 2018 Senator | 78,473 | 47,955 | 30,471 | 61.1% | +17,484 | +22.3 |
| 2020 President | 99,697 | 51,553 | 46,412 | 52.6% | +5,141 | +5.2 |
| 2022 Governor | 81,821 | 45,258 | 35,573 | 56.0% | +9,685 | +12.0 |
| 2022 Senator | 81,638 | 42,913 | 38,557 | 52.7% | +4,356 | +5.3 |
| 2024 President | 104,667 | 52,045 | 50,964 | 50.5% | +1,081 | +1.0 |
| 2024 Senator | 103,790 | 53,224 | 48,442 | 52.4% | +4,782 | +4.7 |
| 2024 NA | NA | NA | NA | NA | NA | NA |
| 2025 WI Sup. Ct.3 | 74,857 | 44,121 | 30,685 | 59.0% | +13,436 | +18.0 |
| 1 Share of the two-party vote. For Rep. share, subtract from 100. | ||||||
| 2 Dem % of the two-party vote minus Rep % of the two-party vote | ||||||
| 3 Formally nonpartisan candidates assigned party labels based on state endorsements | ||||||
| Election results allocated into 2024 district boundaries based on population overlap. Calculations by John Johnson (johndjohnson.info). | ||||||
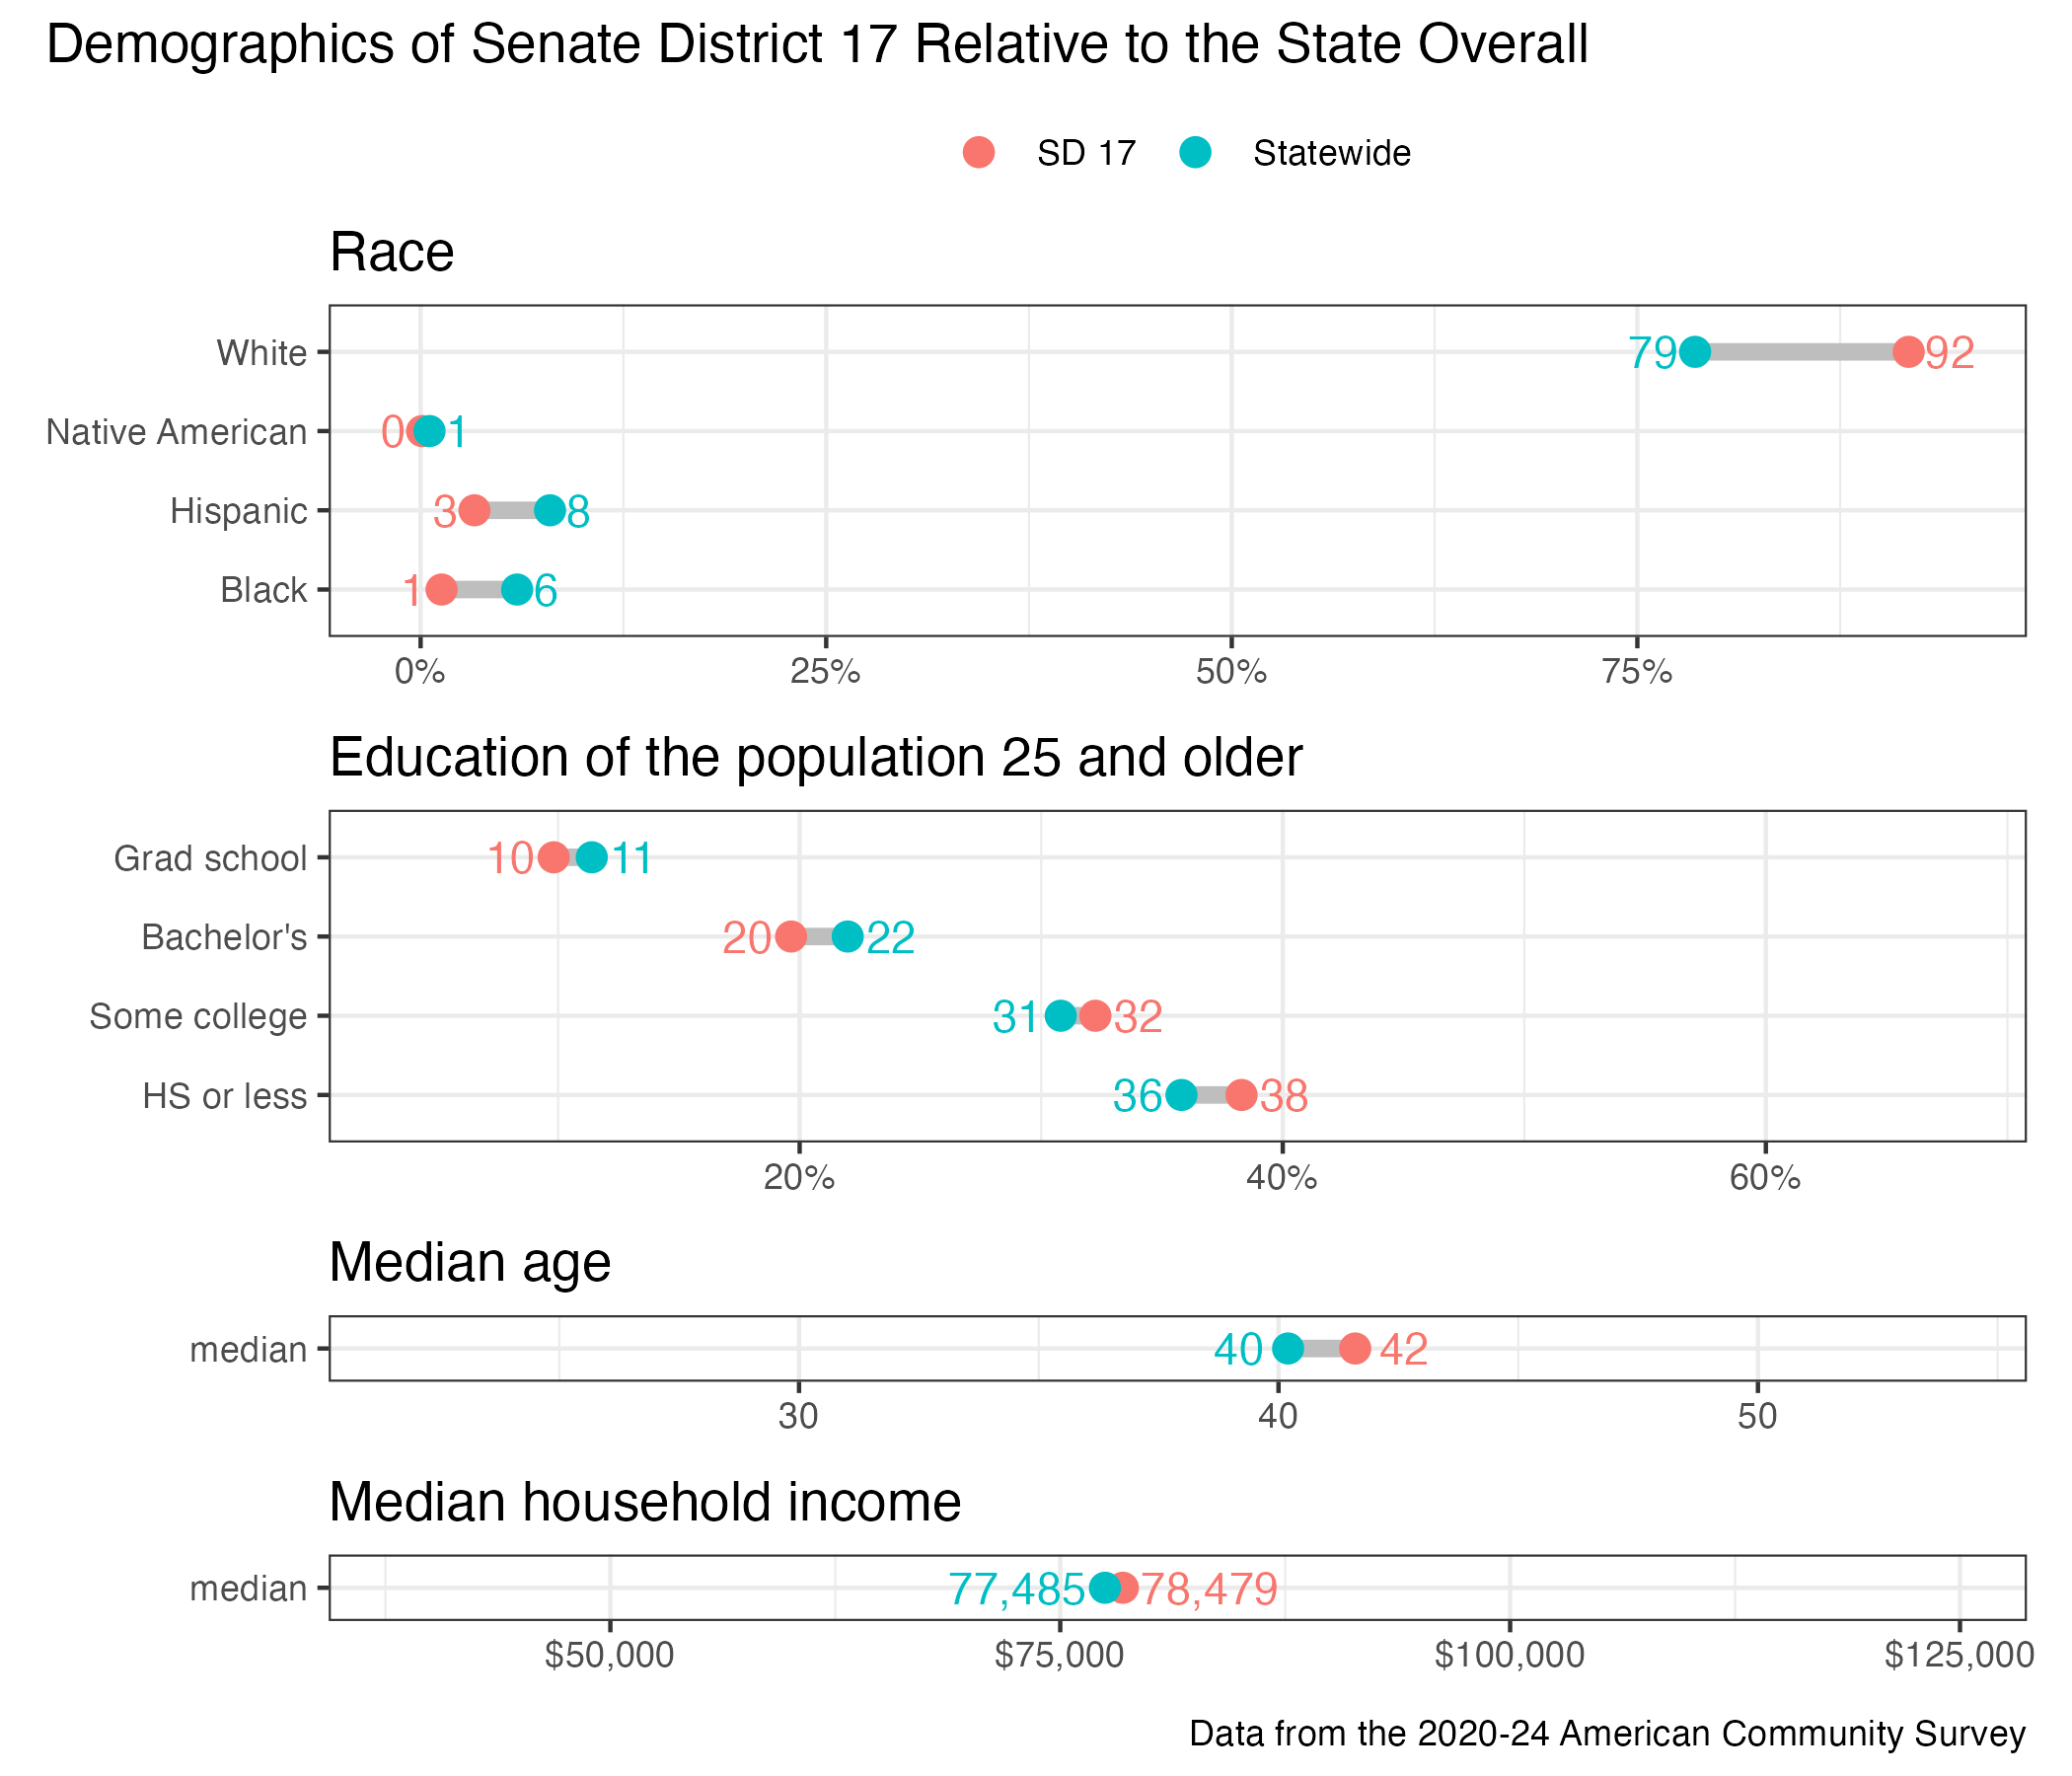
District demographics