15th Assembly District
District
Candidates
| Assembly District 15 Candidates on the Primary Ballot | ||
| Incumbent: Adam Neylon | ||
Jan 1 thru July 30
|
||
|---|---|---|
| receipts | disbursements | |
| Republican | ||
| Adam Neylon | $5,809.35 | $11,429.41 |
| Democratic | ||
| Stephen Tryon | $7,864.55 | $4,095.88 |
| Data from the 2026 July Continuing Report. Any amended reports might not yet be shown. | ||
Past election results
| Election Results in Wisconsin State Assembly District 15 | ||||||
votes
|
Dem. %1 |
margin (Dem. - Rep.)
|
||||
|---|---|---|---|---|---|---|
| total | Dem. | Rep. | votes | points2 | ||
| 2016 President | 34,195 | 12,178 | 19,760 | 38.1% | −7,582 | −23.7 |
| 2016 Senator | 34,242 | 10,883 | 22,773 | 32.3% | −11,890 | −35.3 |
| 2018 Governor | 32,080 | 11,016 | 20,665 | 34.8% | −9,649 | −30.5 |
| 2018 Senator | 31,929 | 12,762 | 19,128 | 40.0% | −6,366 | −20.0 |
| 2020 President | 38,559 | 16,288 | 21,701 | 42.9% | −5,413 | −14.2 |
| 2022 Governor | 32,053 | 13,744 | 18,055 | 43.2% | −4,311 | −13.6 |
| 2022 Senator | 31,998 | 12,931 | 19,001 | 40.5% | −6,070 | −19.0 |
| 2024 President | 39,364 | 16,818 | 21,712 | 43.6% | −4,894 | −12.7 |
| 2024 Senator | 39,110 | 16,514 | 21,993 | 42.9% | −5,479 | −14.2 |
| 2024 WI Assembly | 38,215 | 15,598 | 22,573 | 40.9% | −6,975 | −18.3 |
| 2025 WI Sup. Ct.3 | 28,683 | 13,131 | 15,538 | 45.8% | −2,407 | −8.4 |
| 1 Share of the two-party vote. For Rep. share, subtract from 100. | ||||||
| 2 Dem % of the two-party vote minus Rep % of the two-party vote | ||||||
| 3 Formally nonpartisan candidates assigned party labels based on state endorsements | ||||||
| Election results allocated into 2024 district boundaries based on population overlap. Calculations by John Johnson (johndjohnson.info). | ||||||
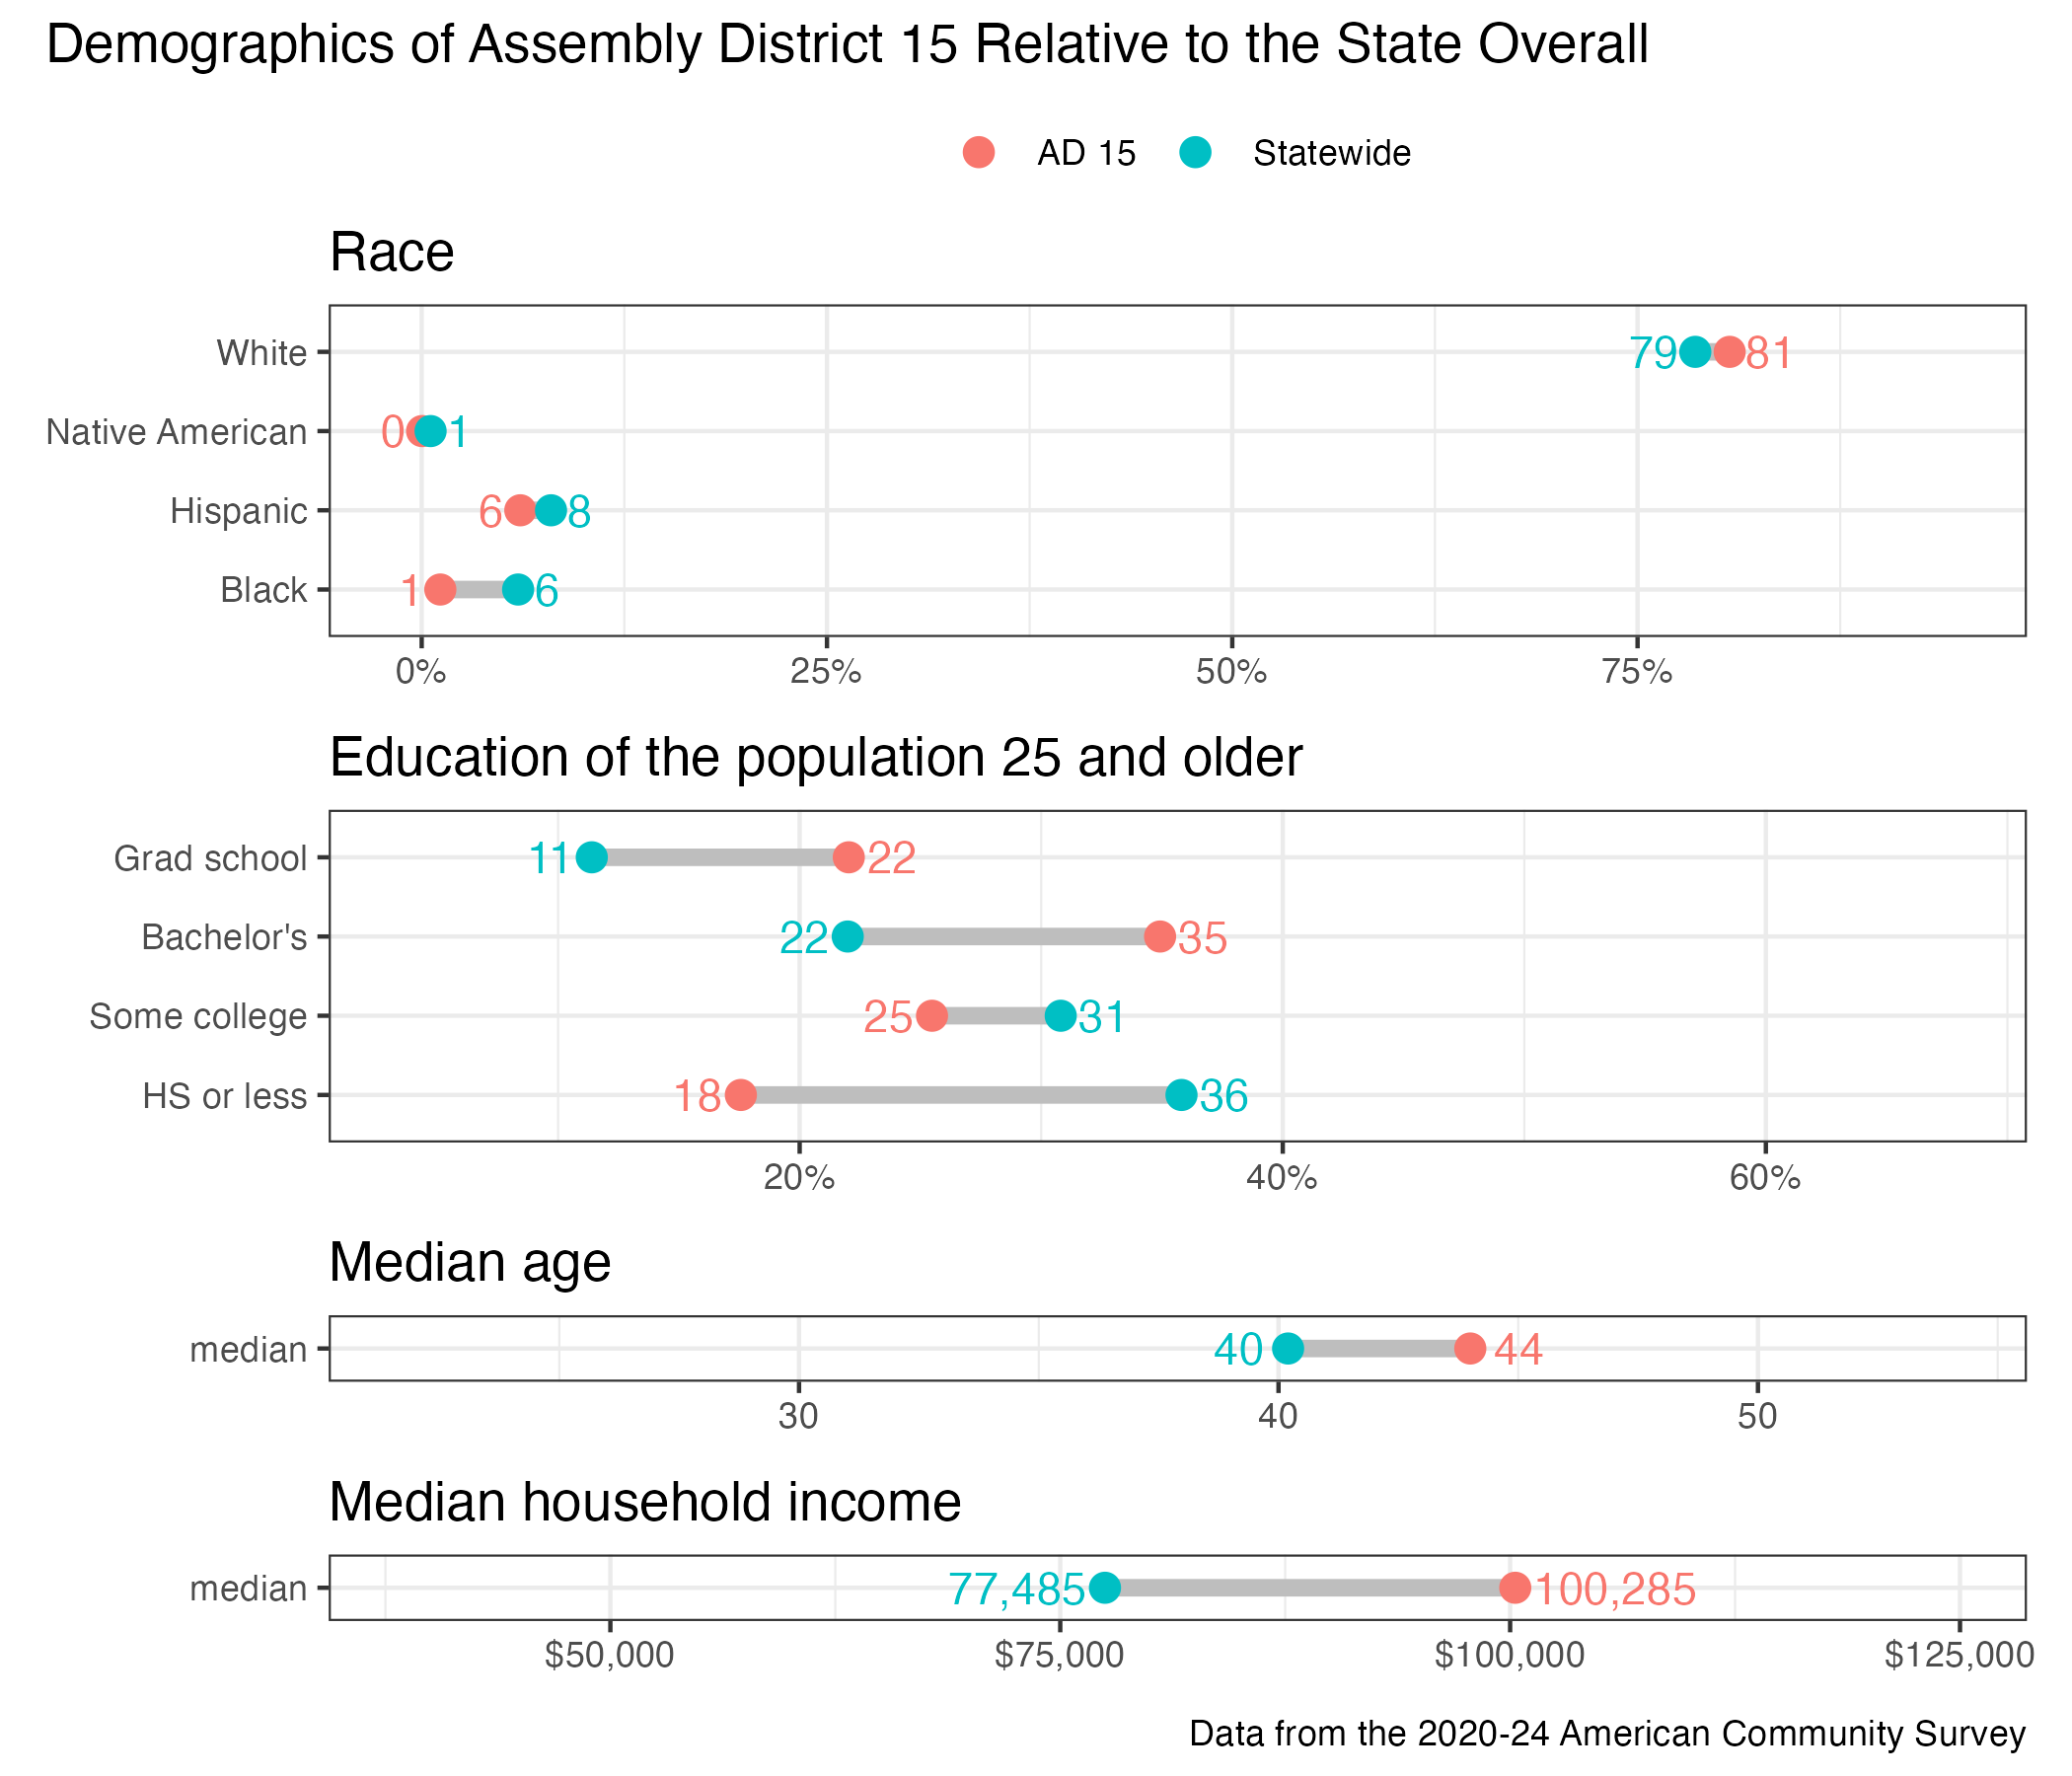
District demographics