13th Senate District
District
Candidates
| Senate District 13 Candidates on the Primary Ballot | ||
| Incumbent: John Jagler | ||
Jan 1 thru July 30
|
||
|---|---|---|
| receipts | disbursements | |
| Republican | ||
| John Jagler | $14,885.00 | $17,362.63 |
| Democratic | ||
| Sasha Ripley | $7,860.00 | $3,145.86 |
| Data from the 2026 July Continuing Report. Any amended reports might not yet be shown. | ||
Past election results
| Election Results in Wisconsin State Senate District 13 | ||||||
votes
|
Dem. %1 |
margin (Dem. - Rep.)
|
||||
|---|---|---|---|---|---|---|
| total | Dem. | Rep. | votes | points2 | ||
| 2016 President | 86,334 | 28,423 | 52,710 | 35.0% | −24,287 | −29.9 |
| 2016 Senator | 85,966 | 30,019 | 53,120 | 36.1% | −23,101 | −27.8 |
| 2018 Governor | 75,633 | 27,980 | 46,203 | 37.7% | −18,223 | −24.6 |
| 2018 Senator | 74,905 | 32,613 | 42,253 | 43.6% | −9,640 | −12.9 |
| 2020 President | 97,397 | 33,846 | 61,987 | 35.3% | −28,141 | −29.4 |
| 2022 Governor | 78,433 | 27,578 | 49,904 | 35.6% | −22,326 | −28.8 |
| 2022 Senator | 78,055 | 26,596 | 51,402 | 34.1% | −24,806 | −31.8 |
| 2024 President | 100,708 | 34,081 | 65,085 | 34.4% | −31,004 | −31.3 |
| 2024 Senator | 99,885 | 34,872 | 62,631 | 35.8% | −27,759 | −28.5 |
| 2024 NA | NA | NA | NA | NA | NA | NA |
| 2025 WI Sup. Ct.3 | 67,777 | 26,332 | 41,435 | 38.9% | −15,103 | −22.3 |
| 1 Share of the two-party vote. For Rep. share, subtract from 100. | ||||||
| 2 Dem % of the two-party vote minus Rep % of the two-party vote | ||||||
| 3 Formally nonpartisan candidates assigned party labels based on state endorsements | ||||||
| Election results allocated into 2024 district boundaries based on population overlap. Calculations by John Johnson (johndjohnson.info). | ||||||
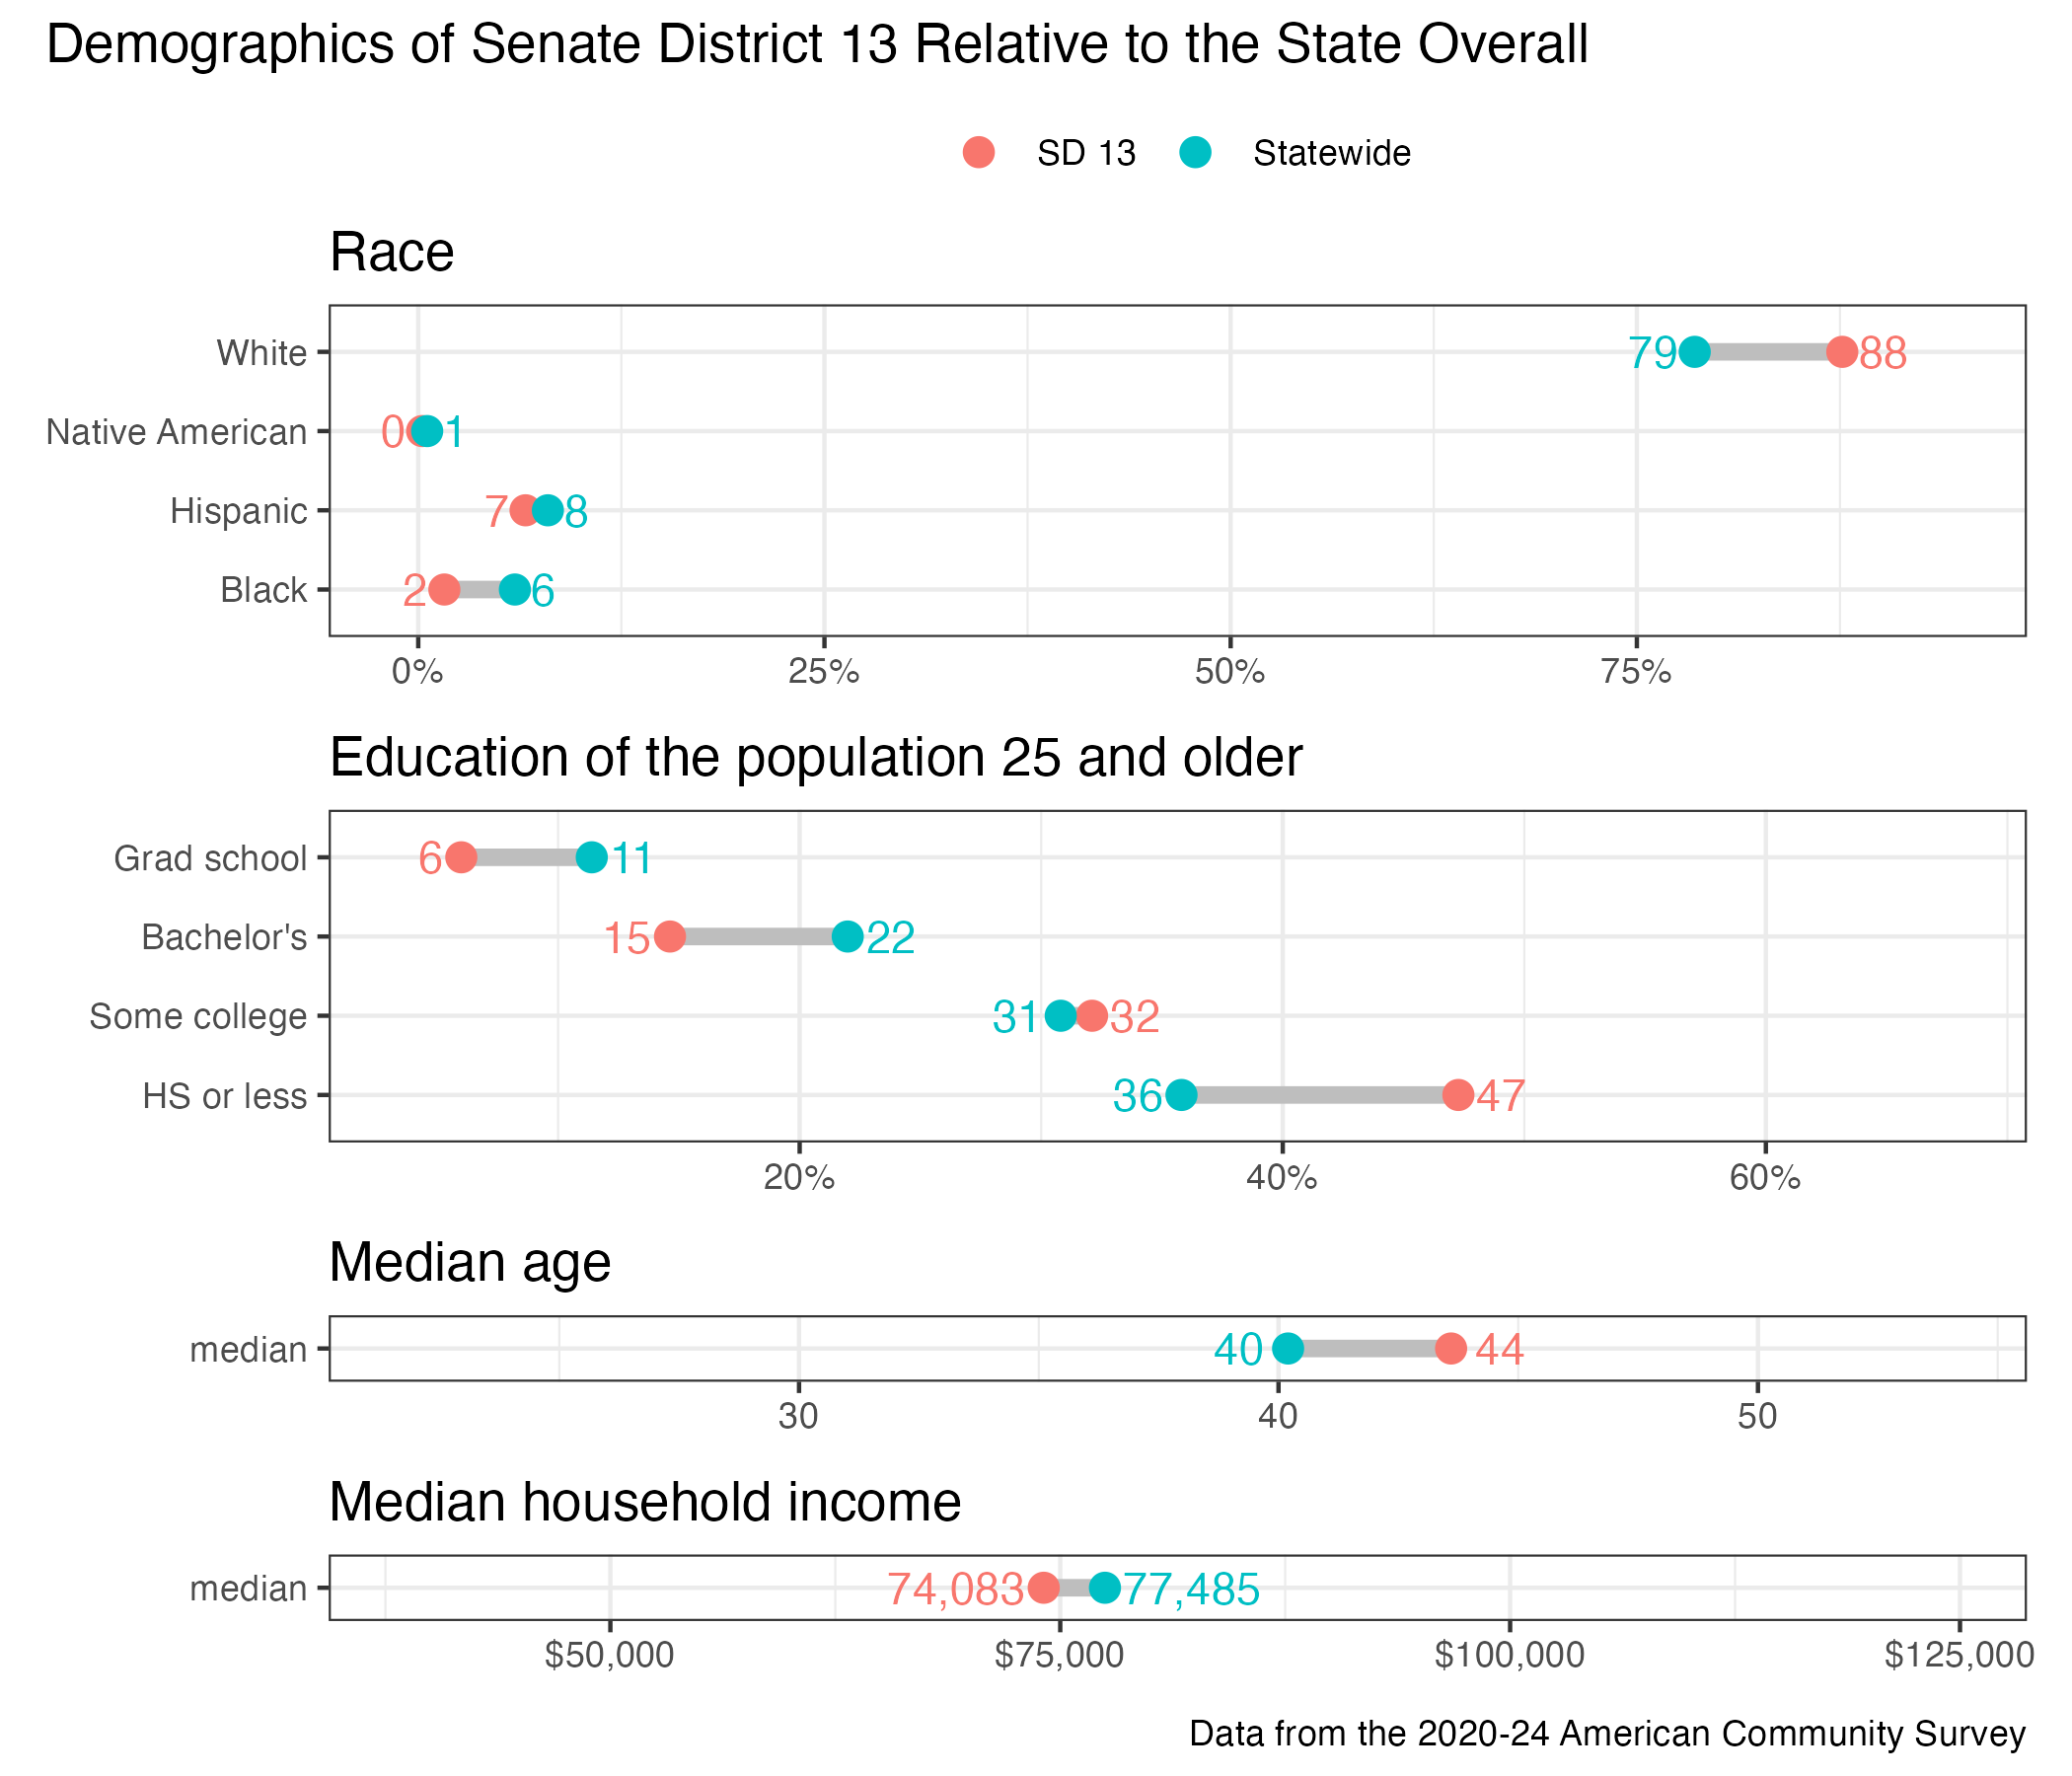
District demographics