11th Senate District
District
Candidates
| Senate District 11 Candidates on the Primary Ballot | ||
| Incumbent: Steve Nass (Filed Notification of Noncandidacy) | ||
Jan 1 thru July 30
|
||
|---|---|---|
| receipts | disbursements | |
| Republican | ||
| Nick Polce | $15,206.38 | $6,358.43 |
| Sandy Wiedmeyer | $39,978.57 | $11,796.66 |
| Ellen Schutt | $99,205.00 | $42,745.93 |
| Democratic | ||
| Adam Duda | $12,940.00 | $15,383.23 |
| Steven J. Doelder | $1,120.00 | $35.55 |
| Data from the 2026 July Continuing Report. Any amended reports might not yet be shown. | ||
Past election results
| Election Results in Wisconsin State Senate District 11 | ||||||
votes
|
Dem. %1 |
margin (Dem. - Rep.)
|
||||
|---|---|---|---|---|---|---|
| total | Dem. | Rep. | votes | points2 | ||
| 2016 President | 87,052 | 29,319 | 52,101 | 36.0% | −22,782 | −28.0 |
| 2016 Senator | 86,554 | 28,990 | 54,689 | 34.6% | −25,699 | −30.7 |
| 2018 Governor | 78,741 | 28,046 | 48,817 | 36.5% | −20,771 | −27.0 |
| 2018 Senator | 78,246 | 33,237 | 44,877 | 42.5% | −11,640 | −14.9 |
| 2020 President | 102,876 | 37,413 | 63,698 | 37.0% | −26,285 | −26.0 |
| 2022 Governor | 81,205 | 30,134 | 49,957 | 37.6% | −19,823 | −24.8 |
| 2022 Senator | 81,107 | 28,812 | 52,065 | 35.6% | −23,253 | −28.8 |
| 2024 President | 107,659 | 38,027 | 68,086 | 35.8% | −30,059 | −28.3 |
| 2024 Senator | 106,638 | 37,752 | 66,264 | 36.3% | −28,512 | −27.4 |
| 2024 NA | NA | NA | NA | NA | NA | NA |
| 2025 WI Sup. Ct.3 | 73,555 | 30,125 | 43,376 | 41.0% | −13,251 | −18.0 |
| 1 Share of the two-party vote. For Rep. share, subtract from 100. | ||||||
| 2 Dem % of the two-party vote minus Rep % of the two-party vote | ||||||
| 3 Formally nonpartisan candidates assigned party labels based on state endorsements | ||||||
| Election results allocated into 2024 district boundaries based on population overlap. Calculations by John Johnson (johndjohnson.info). | ||||||
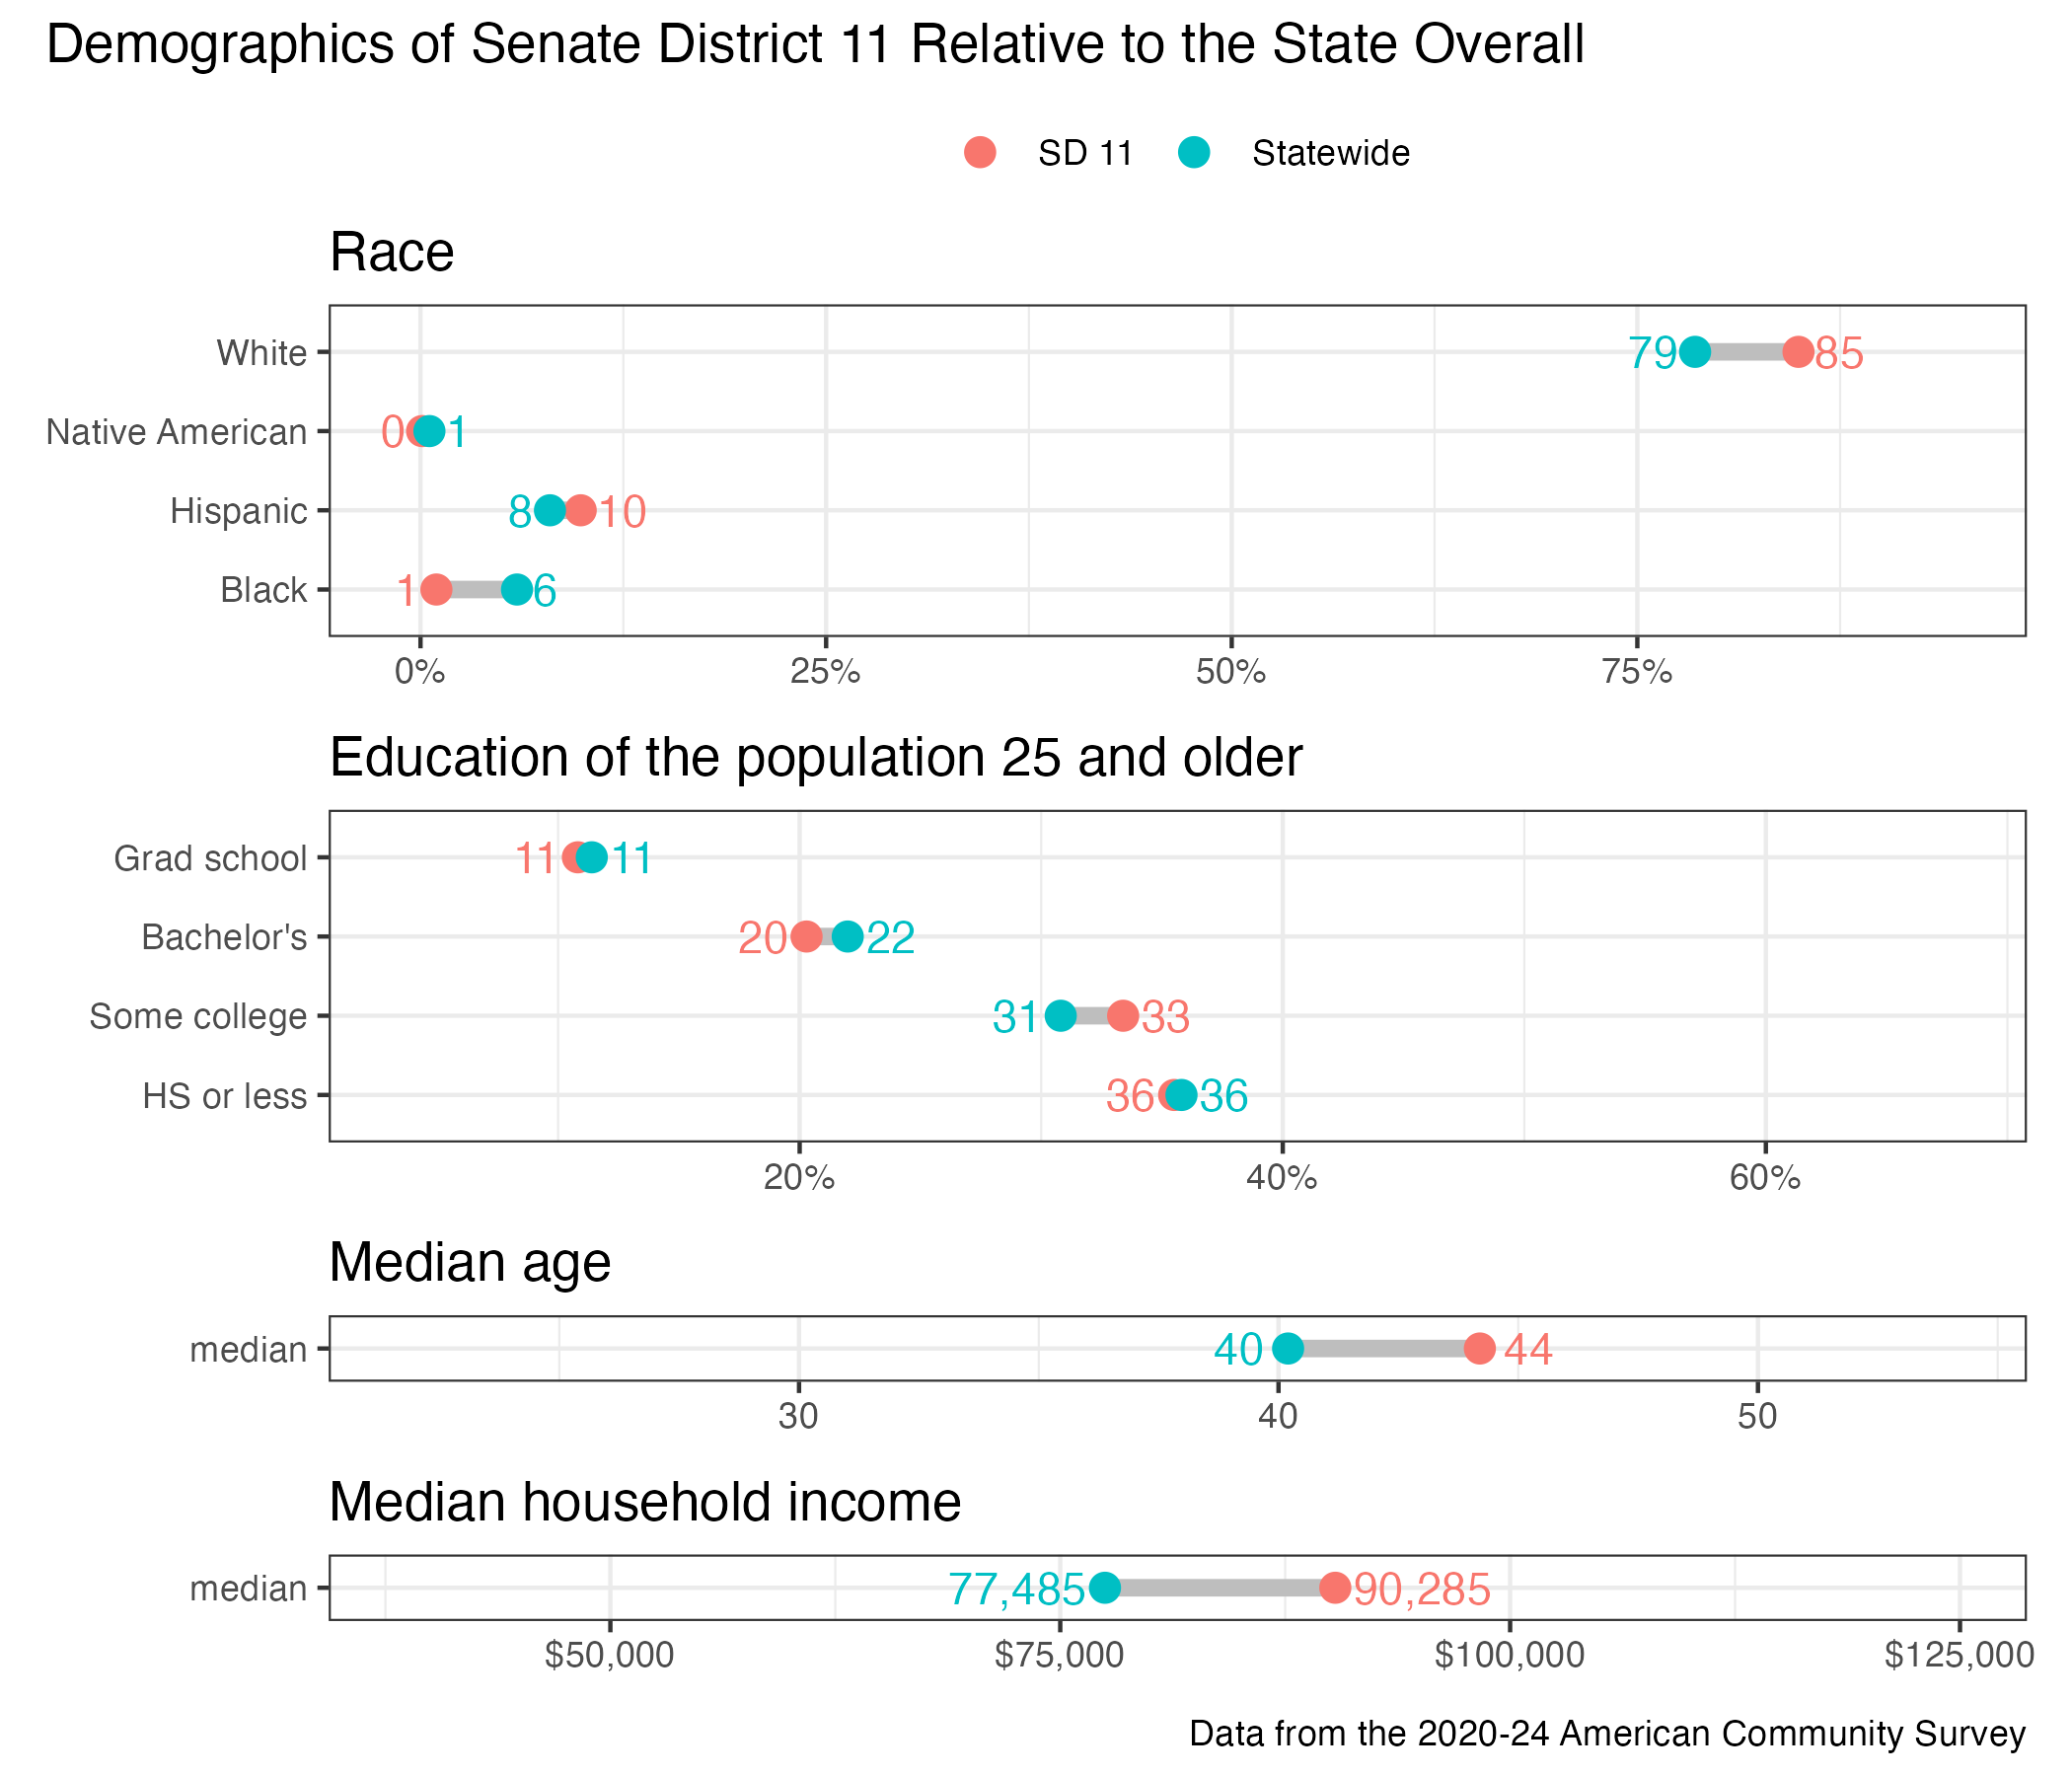
District demographics