6th Assembly District
District
Candidates
| Assembly District 6 Candidates on the Primary Ballot | ||
| Incumbent: Elijah Behnke | ||
Jan 1 thru July 30
|
||
|---|---|---|
| receipts | disbursements | |
| Republican | ||
| Elijah Behnke | $6,353.62 | $5,995.30 |
| Democratic | ||
| Shirley Hinze | $200.00 | $0.00 |
| Data from the 2026 July Continuing Report. Any amended reports might not yet be shown. | ||
Past election results
| Election Results in Wisconsin State Assembly District 6 | ||||||
votes
|
Dem. %1 |
margin (Dem. - Rep.)
|
||||
|---|---|---|---|---|---|---|
| total | Dem. | Rep. | votes | points2 | ||
| 2016 President | 27,920 | 8,953 | 17,548 | 33.8% | −8,595 | −32.4 |
| 2016 Senator | 27,537 | 8,798 | 17,659 | 33.3% | −8,861 | −33.5 |
| 2018 Governor | 25,076 | 9,027 | 15,588 | 36.7% | −6,561 | −26.7 |
| 2018 Senator | 24,845 | 10,634 | 14,201 | 42.8% | −3,567 | −14.4 |
| 2020 President | 32,041 | 10,742 | 20,865 | 34.0% | −10,123 | −32.0 |
| 2022 Governor | 25,670 | 8,965 | 16,378 | 35.4% | −7,413 | −29.3 |
| 2022 Senator | 25,606 | 8,433 | 17,152 | 33.0% | −8,719 | −34.1 |
| 2024 President | 33,624 | 11,186 | 22,016 | 33.7% | −10,830 | −32.6 |
| 2024 Senator | 33,316 | 11,409 | 20,973 | 35.2% | −9,564 | −29.5 |
| 2024 WI Assembly | 32,566 | 10,593 | 21,941 | 32.6% | −11,348 | −34.9 |
| 2025 WI Sup. Ct.3 | 21,662 | 8,301 | 13,351 | 38.3% | −5,050 | −23.3 |
| 1 Share of the two-party vote. For Rep. share, subtract from 100. | ||||||
| 2 Dem % of the two-party vote minus Rep % of the two-party vote | ||||||
| 3 Formally nonpartisan candidates assigned party labels based on state endorsements | ||||||
| Election results allocated into 2024 district boundaries based on population overlap. Calculations by John Johnson (johndjohnson.info). | ||||||
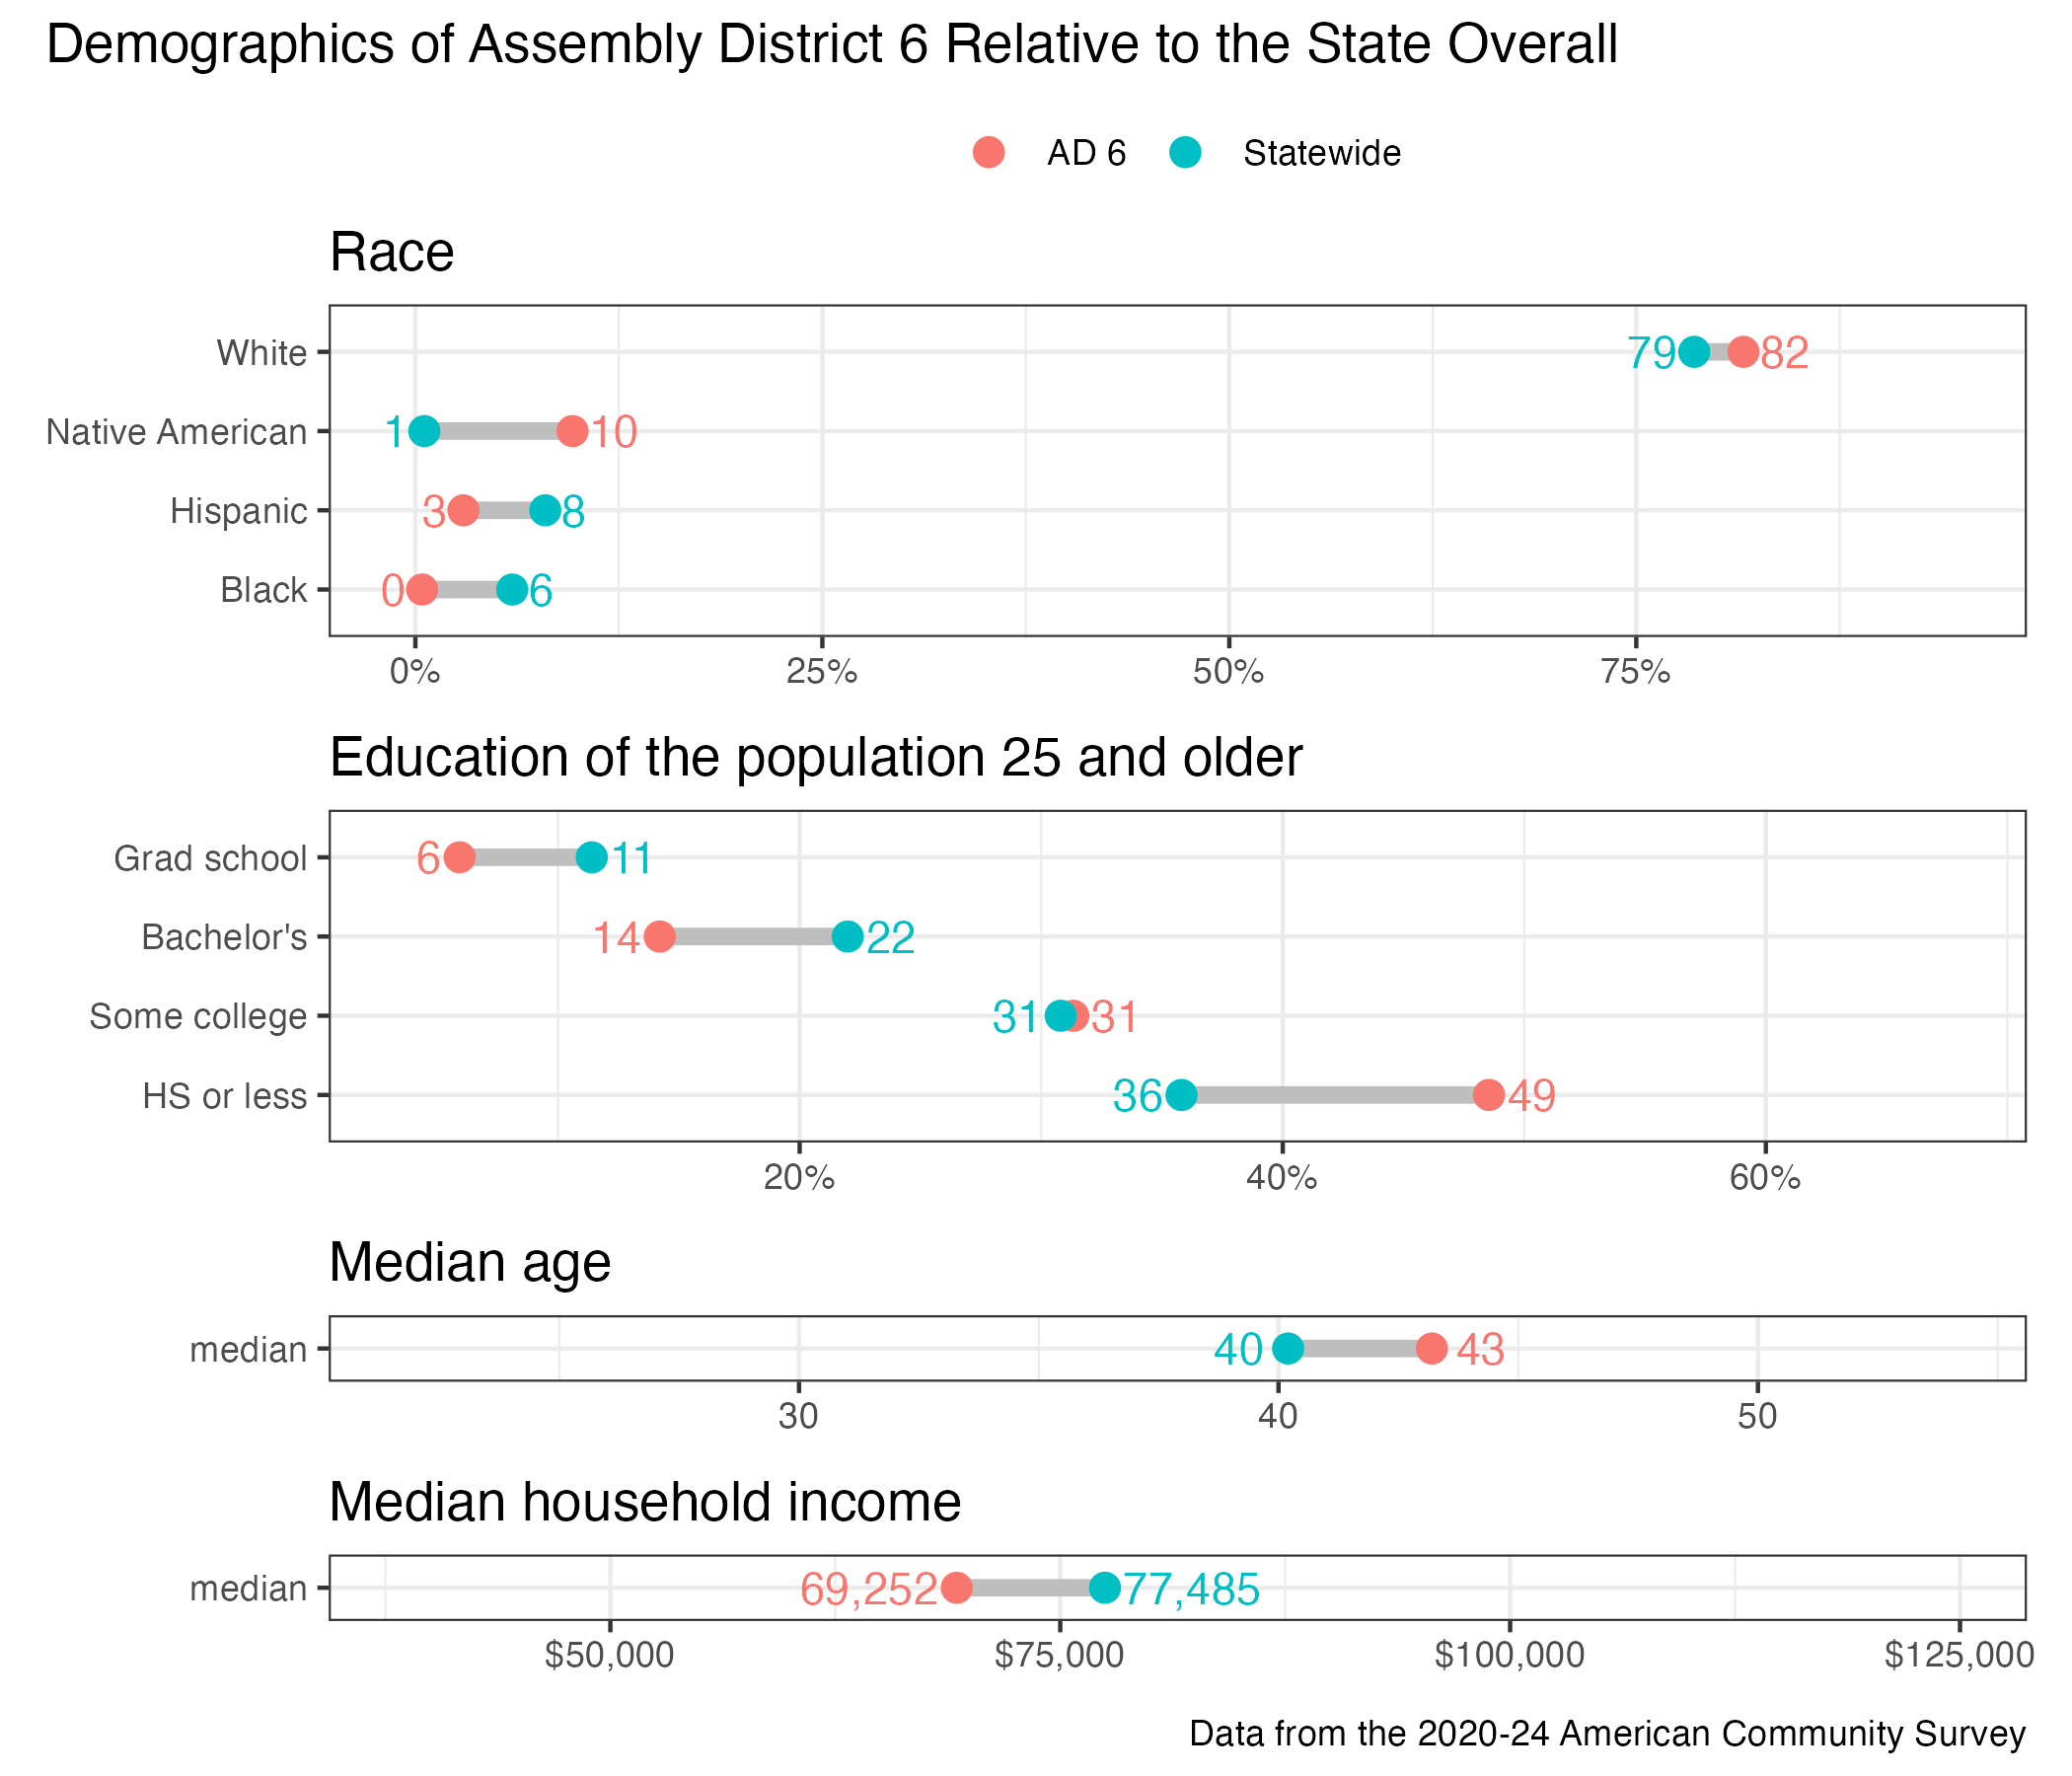
District demographics