38th Assembly District
District
Candidates
| Assembly District 38 Candidates on the Primary Ballot | ||
| Incumbent: William Penterman | ||
Jan 1 thru July 30
|
||
|---|---|---|
| receipts | disbursements | |
| Republican | ||
| William Penterman | $10,467.32 | $11,683.65 |
| Democratic | ||
| Terri Wenkman | $15,787.02 | $1,126.18 |
| Data from the 2026 July Continuing Report. Any amended reports might not yet be shown. | ||
Past election results
| Election Results in Wisconsin State Assembly District 38 | ||||||
votes
|
Dem. %1 |
margin (Dem. - Rep.)
|
||||
|---|---|---|---|---|---|---|
| total | Dem. | Rep. | votes | points2 | ||
| 2016 President | 29,479 | 9,548 | 17,993 | 34.7% | −8,445 | −30.7 |
| 2016 Senator | 29,412 | 9,963 | 18,526 | 35.0% | −8,563 | −30.1 |
| 2018 Governor | 25,779 | 9,126 | 16,159 | 36.1% | −7,033 | −27.8 |
| 2018 Senator | 25,556 | 10,781 | 14,759 | 42.2% | −3,978 | −15.6 |
| 2020 President | 33,290 | 11,566 | 21,106 | 35.4% | −9,540 | −29.2 |
| 2022 Governor | 26,290 | 9,283 | 16,659 | 35.8% | −7,376 | −28.4 |
| 2022 Senator | 26,118 | 8,939 | 17,161 | 34.2% | −8,222 | −31.5 |
| 2024 President | 34,438 | 11,687 | 22,181 | 34.5% | −10,494 | −31.0 |
| 2024 Senator | 34,148 | 11,839 | 21,513 | 35.5% | −9,674 | −29.0 |
| 2024 WI Assembly | 32,948 | 10,745 | 22,163 | 32.7% | −11,418 | −34.7 |
| 2025 WI Sup. Ct.3 | 23,411 | 9,077 | 14,328 | 38.8% | −5,251 | −22.4 |
| 1 Share of the two-party vote. For Rep. share, subtract from 100. | ||||||
| 2 Dem % of the two-party vote minus Rep % of the two-party vote | ||||||
| 3 Formally nonpartisan candidates assigned party labels based on state endorsements | ||||||
| Election results allocated into 2024 district boundaries based on population overlap. Calculations by John Johnson (johndjohnson.info). | ||||||
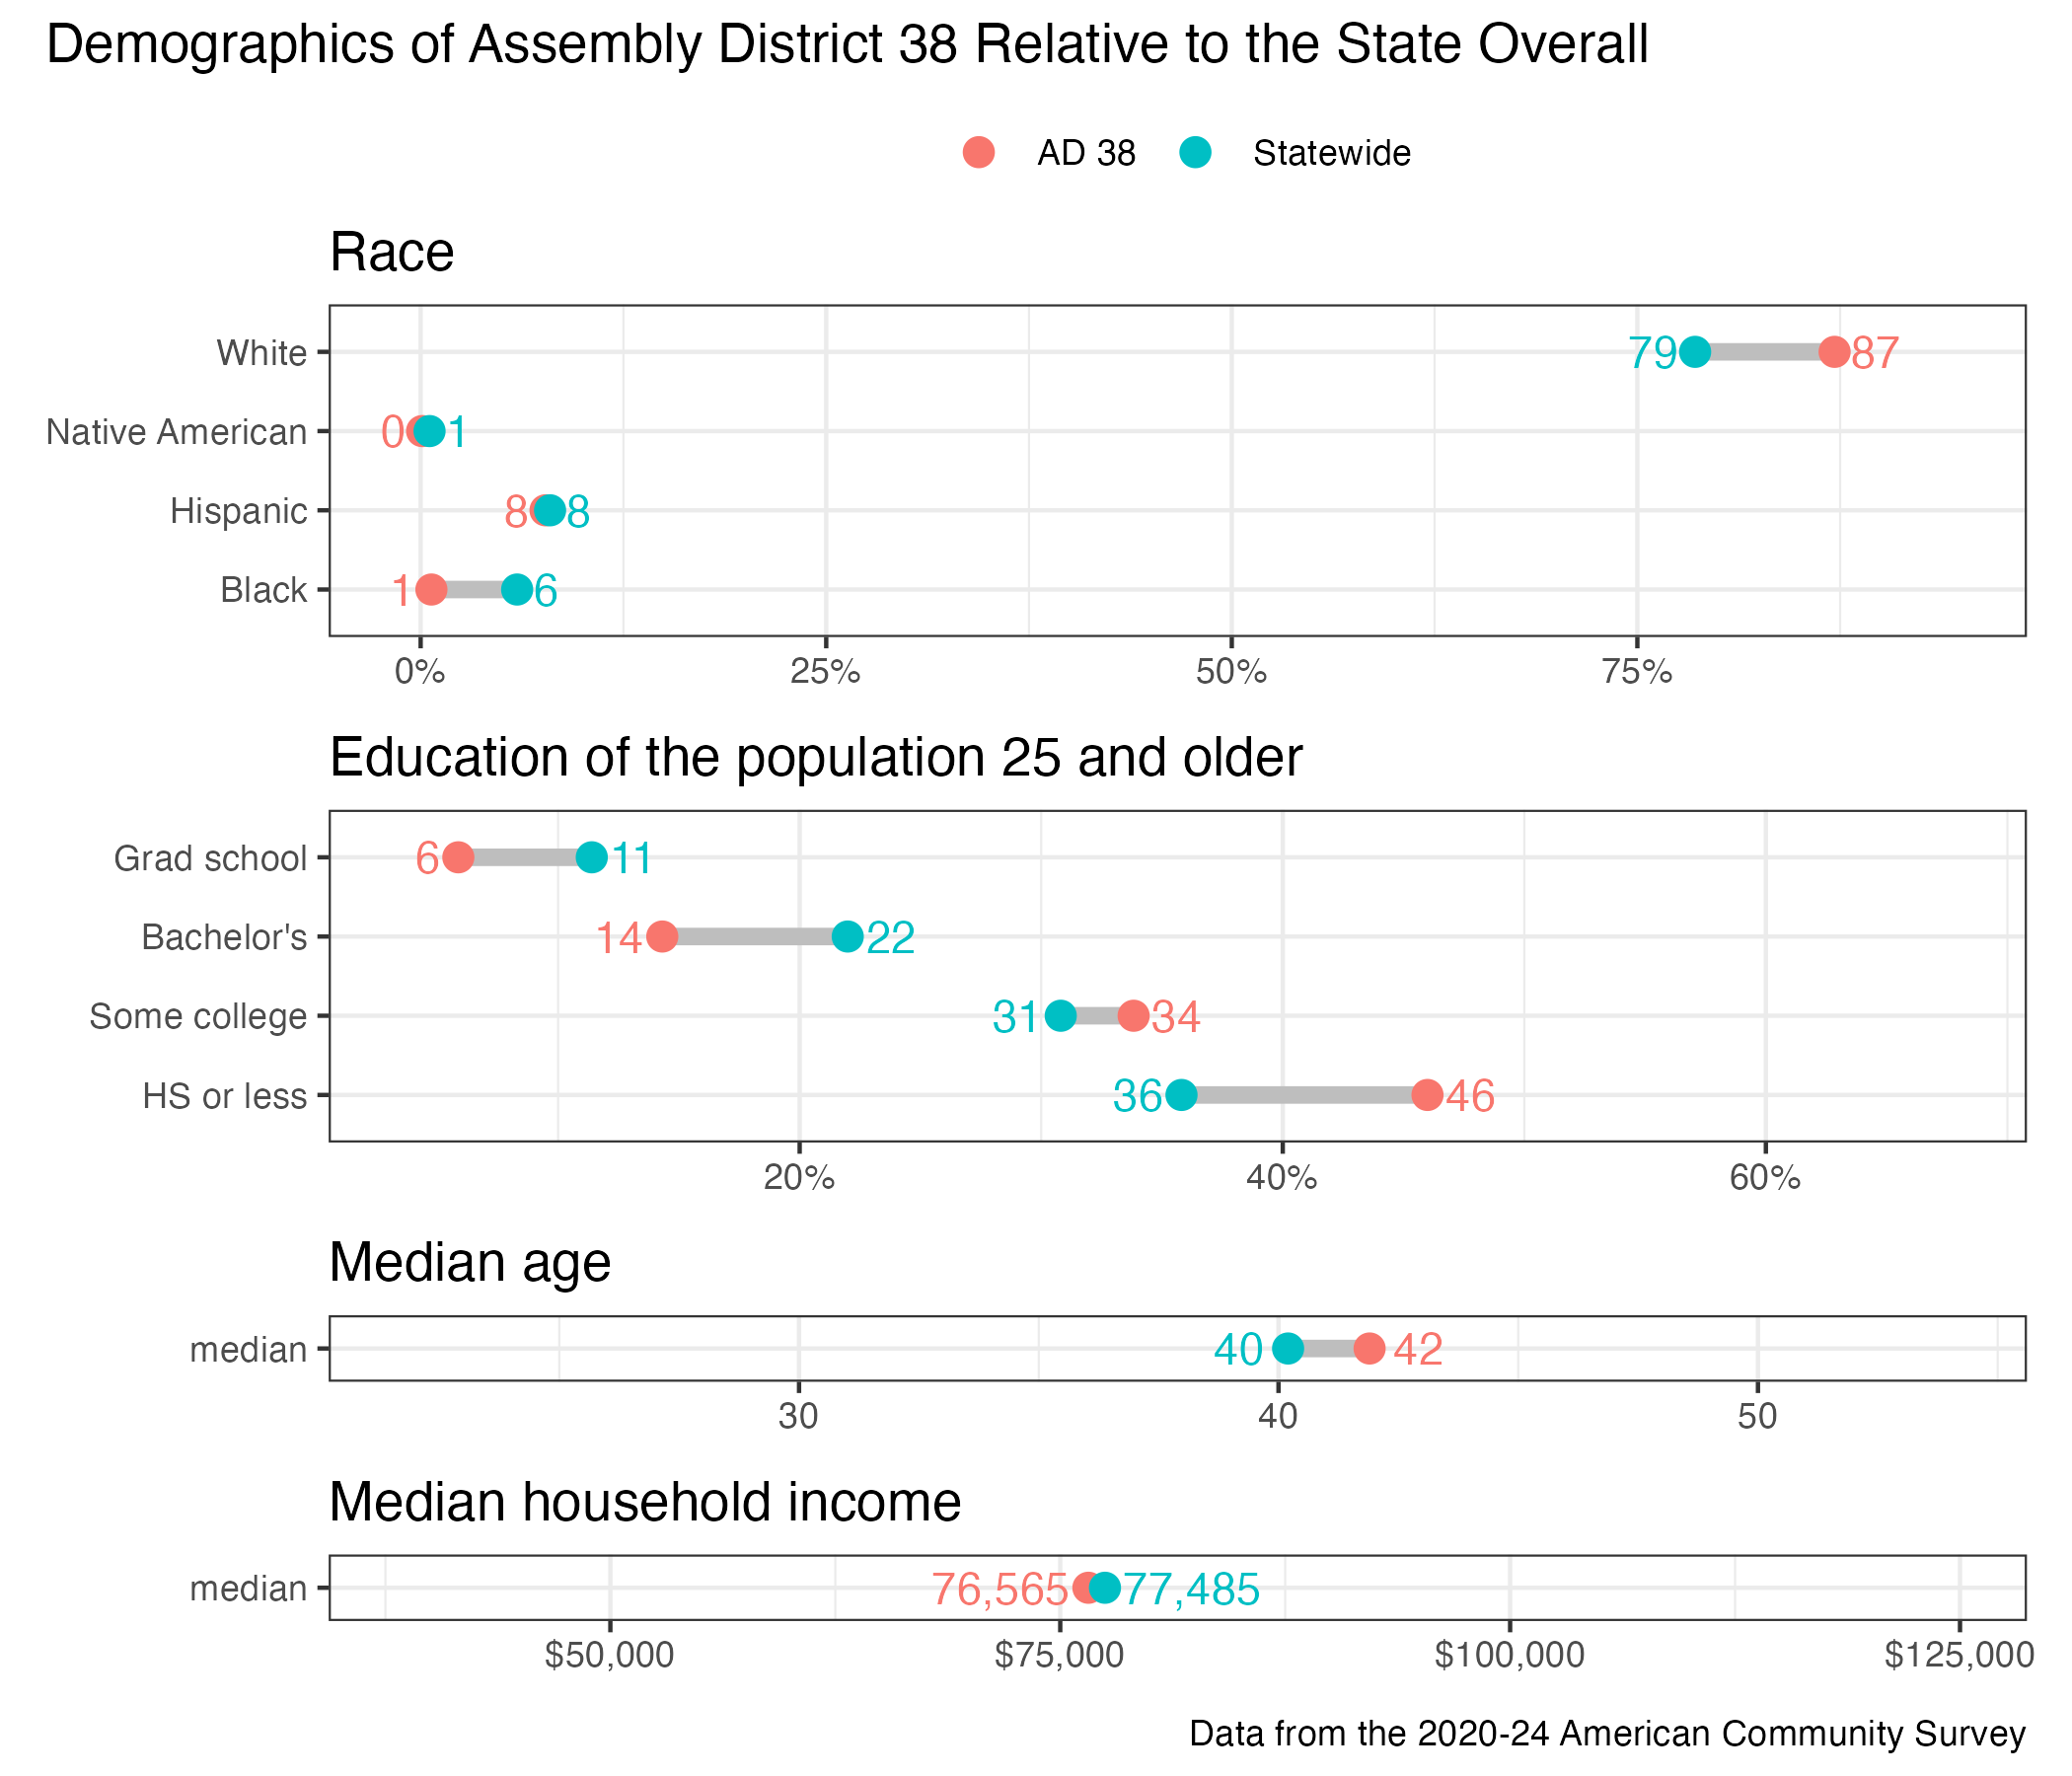
District demographics