49th Assembly District
District
Candidates
| Assembly District 49 Candidates on the Primary Ballot | ||
| Incumbent: Travis Tranel | ||
Jan 1 thru July 30
|
||
|---|---|---|
| receipts | disbursements | |
| Republican | ||
| Travis Tranel | $12,261.63 | $5,367.47 |
| Democratic | ||
| John Rindy | $5,819.00 | $5,438.91 |
| Data from the 2026 July Continuing Report. Any amended reports might not yet be shown. | ||
Past election results
| Election Results in Wisconsin State Assembly District 49 | ||||||
votes
|
Dem. %1 |
margin (Dem. - Rep.)
|
||||
|---|---|---|---|---|---|---|
| total | Dem. | Rep. | votes | points2 | ||
| 2016 President | 28,509 | 11,917 | 14,407 | 45.3% | −2,490 | −9.5 |
| 2016 Senator | 28,016 | 12,878 | 14,186 | 47.6% | −1,308 | −4.8 |
| 2018 Governor | 23,093 | 11,430 | 11,158 | 50.6% | +272 | +1.2 |
| 2018 Senator | 22,886 | 12,664 | 10,217 | 55.3% | +2,447 | +10.7 |
| 2020 President | 30,162 | 13,075 | 16,546 | 44.1% | −3,471 | −11.7 |
| 2022 Governor | 23,873 | 11,118 | 12,448 | 47.2% | −1,330 | −5.6 |
| 2022 Senator | 23,878 | 10,442 | 13,388 | 43.8% | −2,946 | −12.4 |
| 2024 President | 32,142 | 13,071 | 18,583 | 41.3% | −5,512 | −17.4 |
| 2024 Senator | 31,741 | 13,492 | 17,479 | 43.6% | −3,987 | −12.9 |
| 2024 WI Assembly | 31,276 | 11,546 | 19,701 | 37.0% | −8,155 | −26.1 |
| 2025 WI Sup. Ct.3 | 21,140 | 10,612 | 10,514 | 50.2% | +98 | +0.5 |
| 1 Share of the two-party vote. For Rep. share, subtract from 100. | ||||||
| 2 Dem % of the two-party vote minus Rep % of the two-party vote | ||||||
| 3 Formally nonpartisan candidates assigned party labels based on state endorsements | ||||||
| Election results allocated into 2024 district boundaries based on population overlap. Calculations by John Johnson (johndjohnson.info). | ||||||
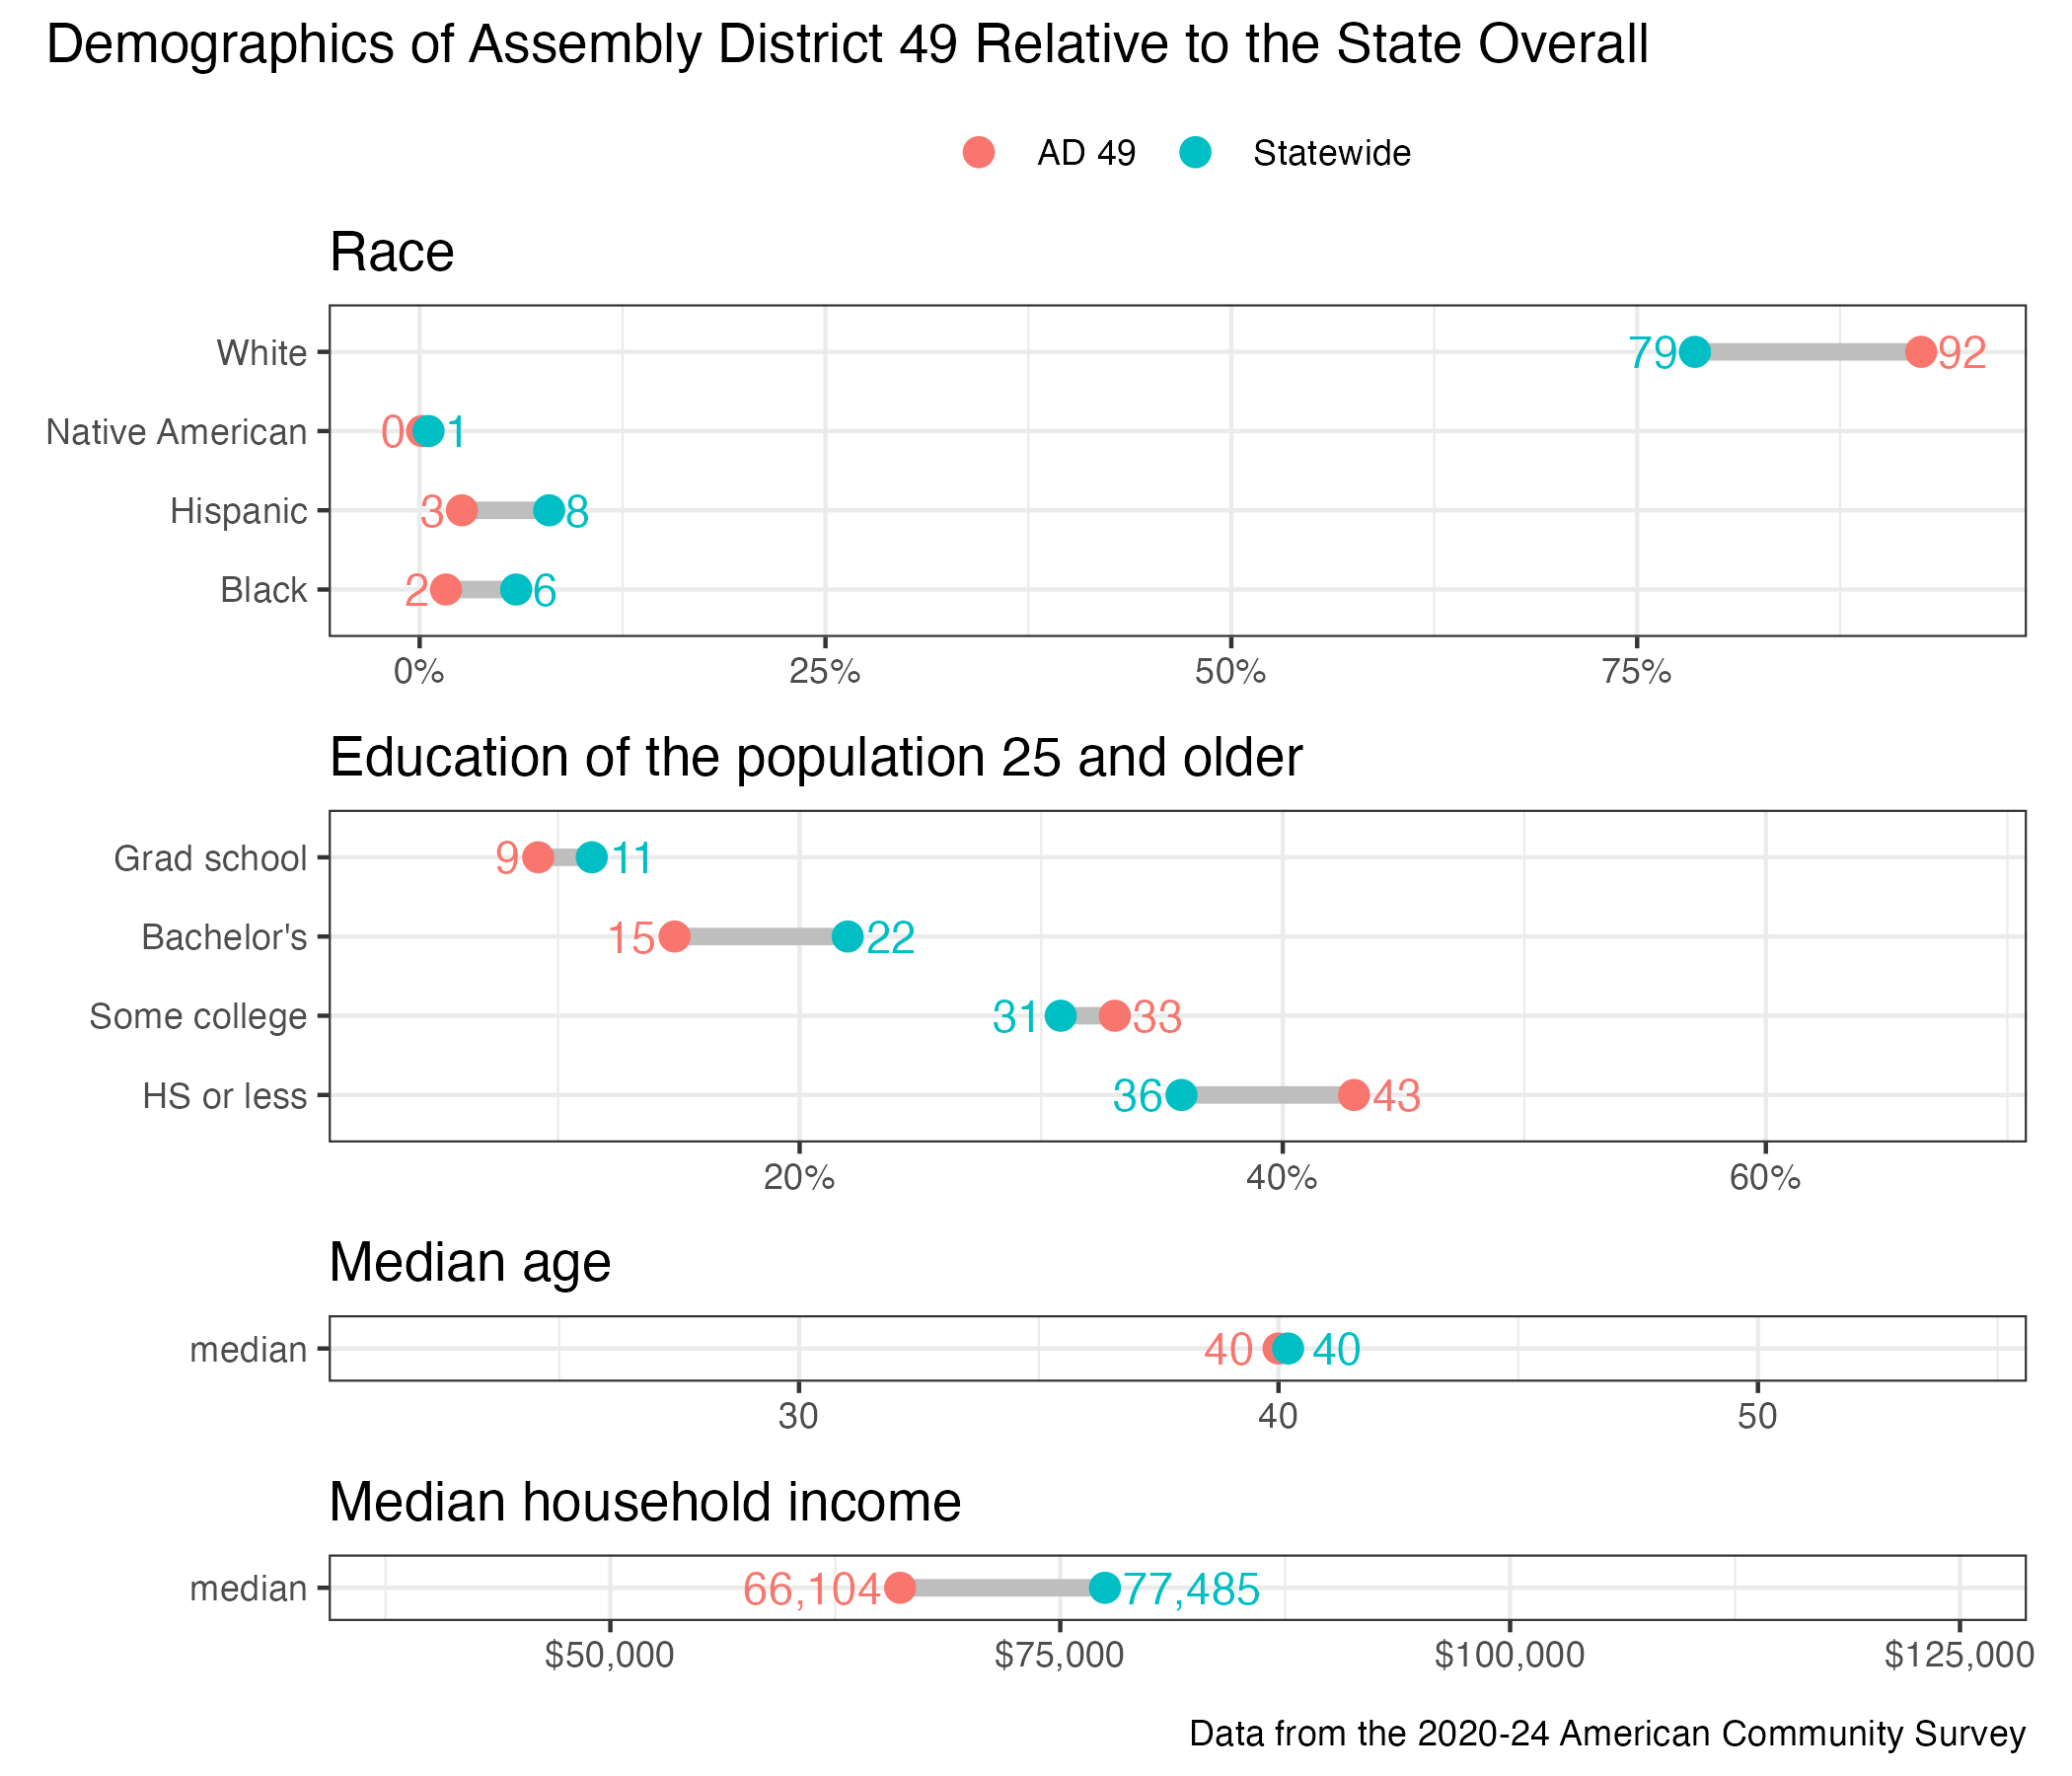
District demographics