41st Assembly District
District
Candidates
| Assembly District 41 Candidates on the Primary Ballot | ||
| Incumbent: Tony Kurtz | ||
Jan 1 thru July 30
|
||
|---|---|---|
| receipts | disbursements | |
| Republican | ||
| Tony Kurtz | $102,145.05 | $33,700.13 |
| Democratic | ||
| Zach Commons | $549.00 | $79.73 |
| Data from the 2026 July Continuing Report. Any amended reports might not yet be shown. | ||
Past election results
| Election Results in Wisconsin State Assembly District 41 | ||||||
votes
|
Dem. %1 |
margin (Dem. - Rep.)
|
||||
|---|---|---|---|---|---|---|
| total | Dem. | Rep. | votes | points2 | ||
| 2016 President | 27,161 | 11,132 | 14,464 | 43.5% | −3,332 | −13.0 |
| 2016 Senator | 27,003 | 12,445 | 13,629 | 47.7% | −1,184 | −4.5 |
| 2018 Governor | 24,120 | 11,664 | 11,933 | 49.4% | −269 | −1.1 |
| 2018 Senator | 24,155 | 12,988 | 11,155 | 53.8% | +1,833 | +7.6 |
| 2020 President | 31,304 | 13,206 | 17,617 | 42.8% | −4,411 | −14.3 |
| 2022 Governor | 24,614 | 11,094 | 13,176 | 45.7% | −2,082 | −8.6 |
| 2022 Senator | 24,568 | 10,445 | 14,099 | 42.6% | −3,654 | −14.9 |
| 2024 President | 32,684 | 13,219 | 18,898 | 41.2% | −5,679 | −17.7 |
| 2024 Senator | 32,364 | 13,676 | 17,845 | 43.4% | −4,169 | −13.2 |
| 2024 WI Assembly | 31,697 | 11,677 | 19,996 | 36.9% | −8,319 | −26.3 |
| 2025 WI Sup. Ct.3 | 20,878 | 10,277 | 10,596 | 49.2% | −319 | −1.5 |
| 1 Share of the two-party vote. For Rep. share, subtract from 100. | ||||||
| 2 Dem % of the two-party vote minus Rep % of the two-party vote | ||||||
| 3 Formally nonpartisan candidates assigned party labels based on state endorsements | ||||||
| Election results allocated into 2024 district boundaries based on population overlap. Calculations by John Johnson (johndjohnson.info). | ||||||
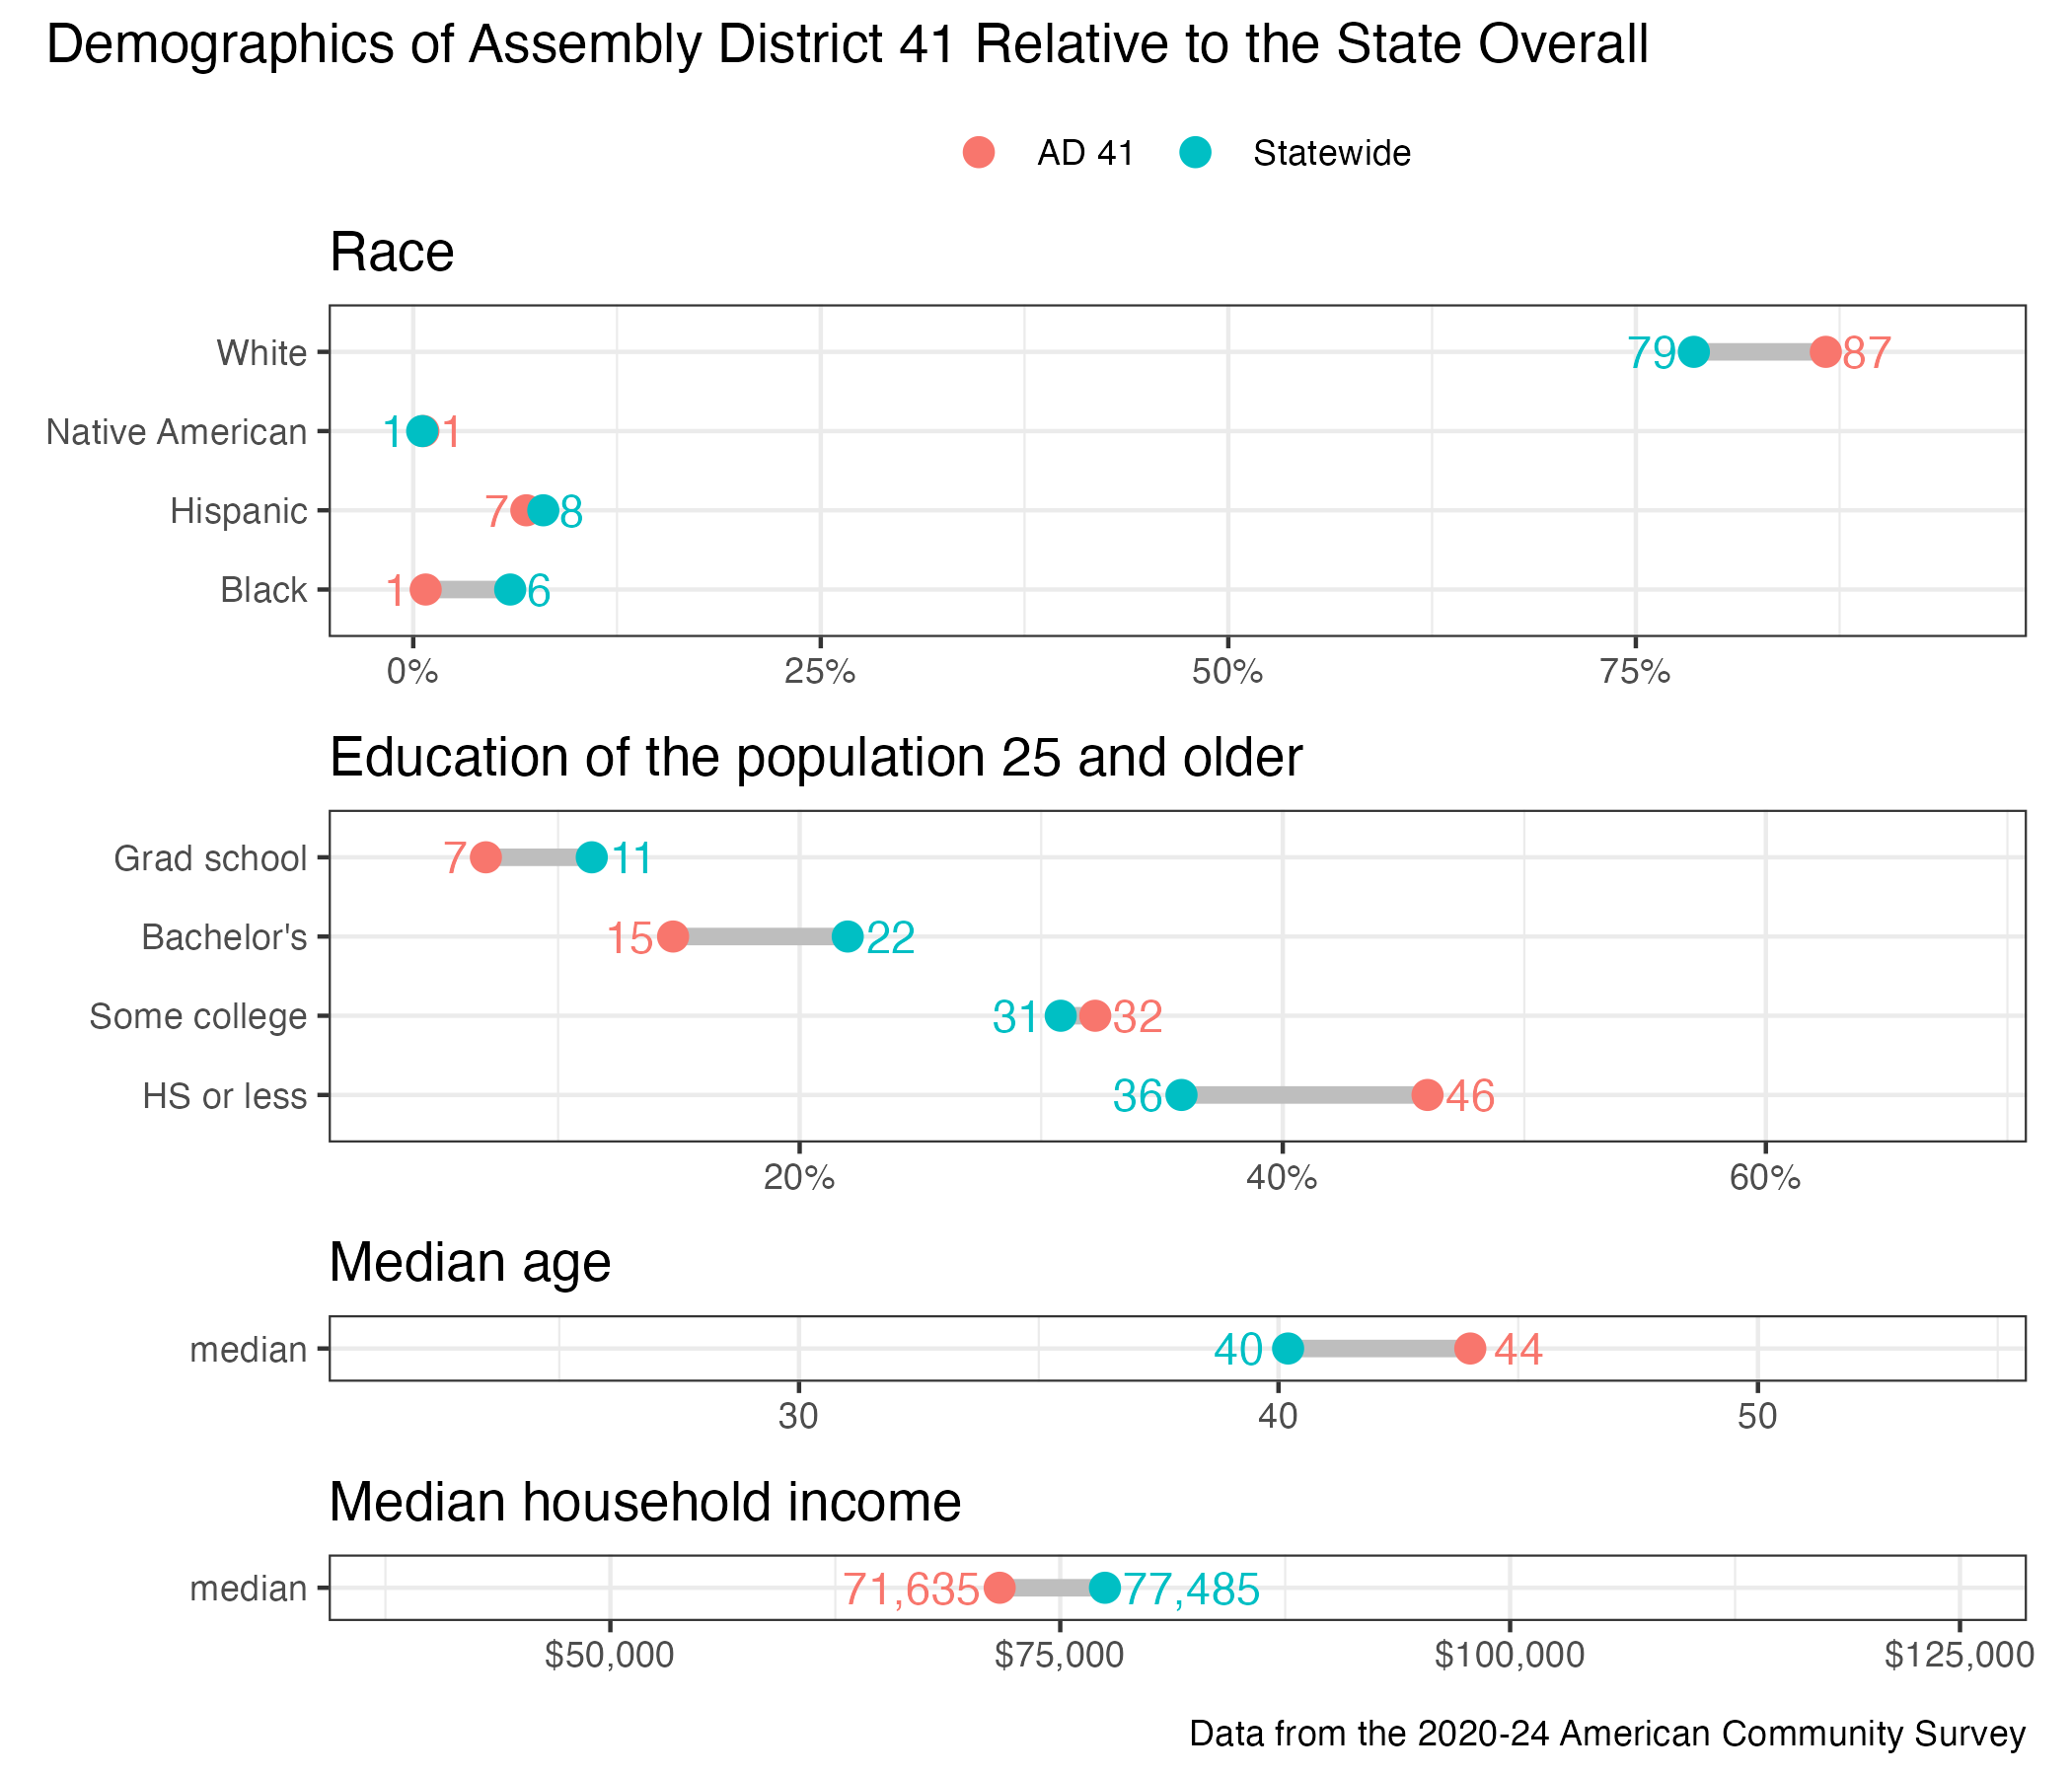
District demographics