56th Assembly District
District
Candidates
| Assembly District 56 Candidates on the Primary Ballot | ||
| Incumbent: Dave Murphy | ||
Jan 1 thru July 30
|
||
|---|---|---|
| receipts | disbursements | |
| Republican | ||
| Anthony W. Phillips | $25,355.26 | $36,903.73 |
| Democratic | ||
| Shawna Riley | $1,265.00 | $278.56 |
| Grace Abitz | $3,850.00 | $2,491.08 |
| Data from the 2026 July Continuing Report. Any amended reports might not yet be shown. | ||
Past election results
| Election Results in Wisconsin State Assembly District 56 | ||||||
votes
|
Dem. %1 |
margin (Dem. - Rep.)
|
||||
|---|---|---|---|---|---|---|
| total | Dem. | Rep. | votes | points2 | ||
| 2016 President | 30,666 | 10,110 | 18,916 | 34.8% | −8,806 | −30.3 |
| 2016 Senator | 30,634 | 9,795 | 19,751 | 33.2% | −9,956 | −33.7 |
| 2018 Governor | 27,281 | 9,743 | 17,080 | 36.3% | −7,337 | −27.4 |
| 2018 Senator | 27,154 | 11,475 | 15,678 | 42.3% | −4,203 | −15.5 |
| 2020 President | 35,630 | 12,768 | 22,278 | 36.4% | −9,510 | −27.1 |
| 2022 Governor | 29,508 | 10,898 | 18,310 | 37.3% | −7,412 | −25.4 |
| 2022 Senator | 29,365 | 10,337 | 19,014 | 35.2% | −8,677 | −29.6 |
| 2024 President | 37,655 | 13,450 | 23,678 | 36.2% | −10,228 | −27.5 |
| 2024 Senator | 37,415 | 13,396 | 23,126 | 36.7% | −9,730 | −26.6 |
| 2024 WI Assembly | 36,745 | 12,950 | 23,789 | 35.2% | −10,839 | −29.5 |
| 2025 WI Sup. Ct.3 | 25,882 | 10,542 | 15,339 | 40.7% | −4,797 | −18.5 |
| 1 Share of the two-party vote. For Rep. share, subtract from 100. | ||||||
| 2 Dem % of the two-party vote minus Rep % of the two-party vote | ||||||
| 3 Formally nonpartisan candidates assigned party labels based on state endorsements | ||||||
| Election results allocated into 2024 district boundaries based on population overlap. Calculations by John Johnson (johndjohnson.info). | ||||||
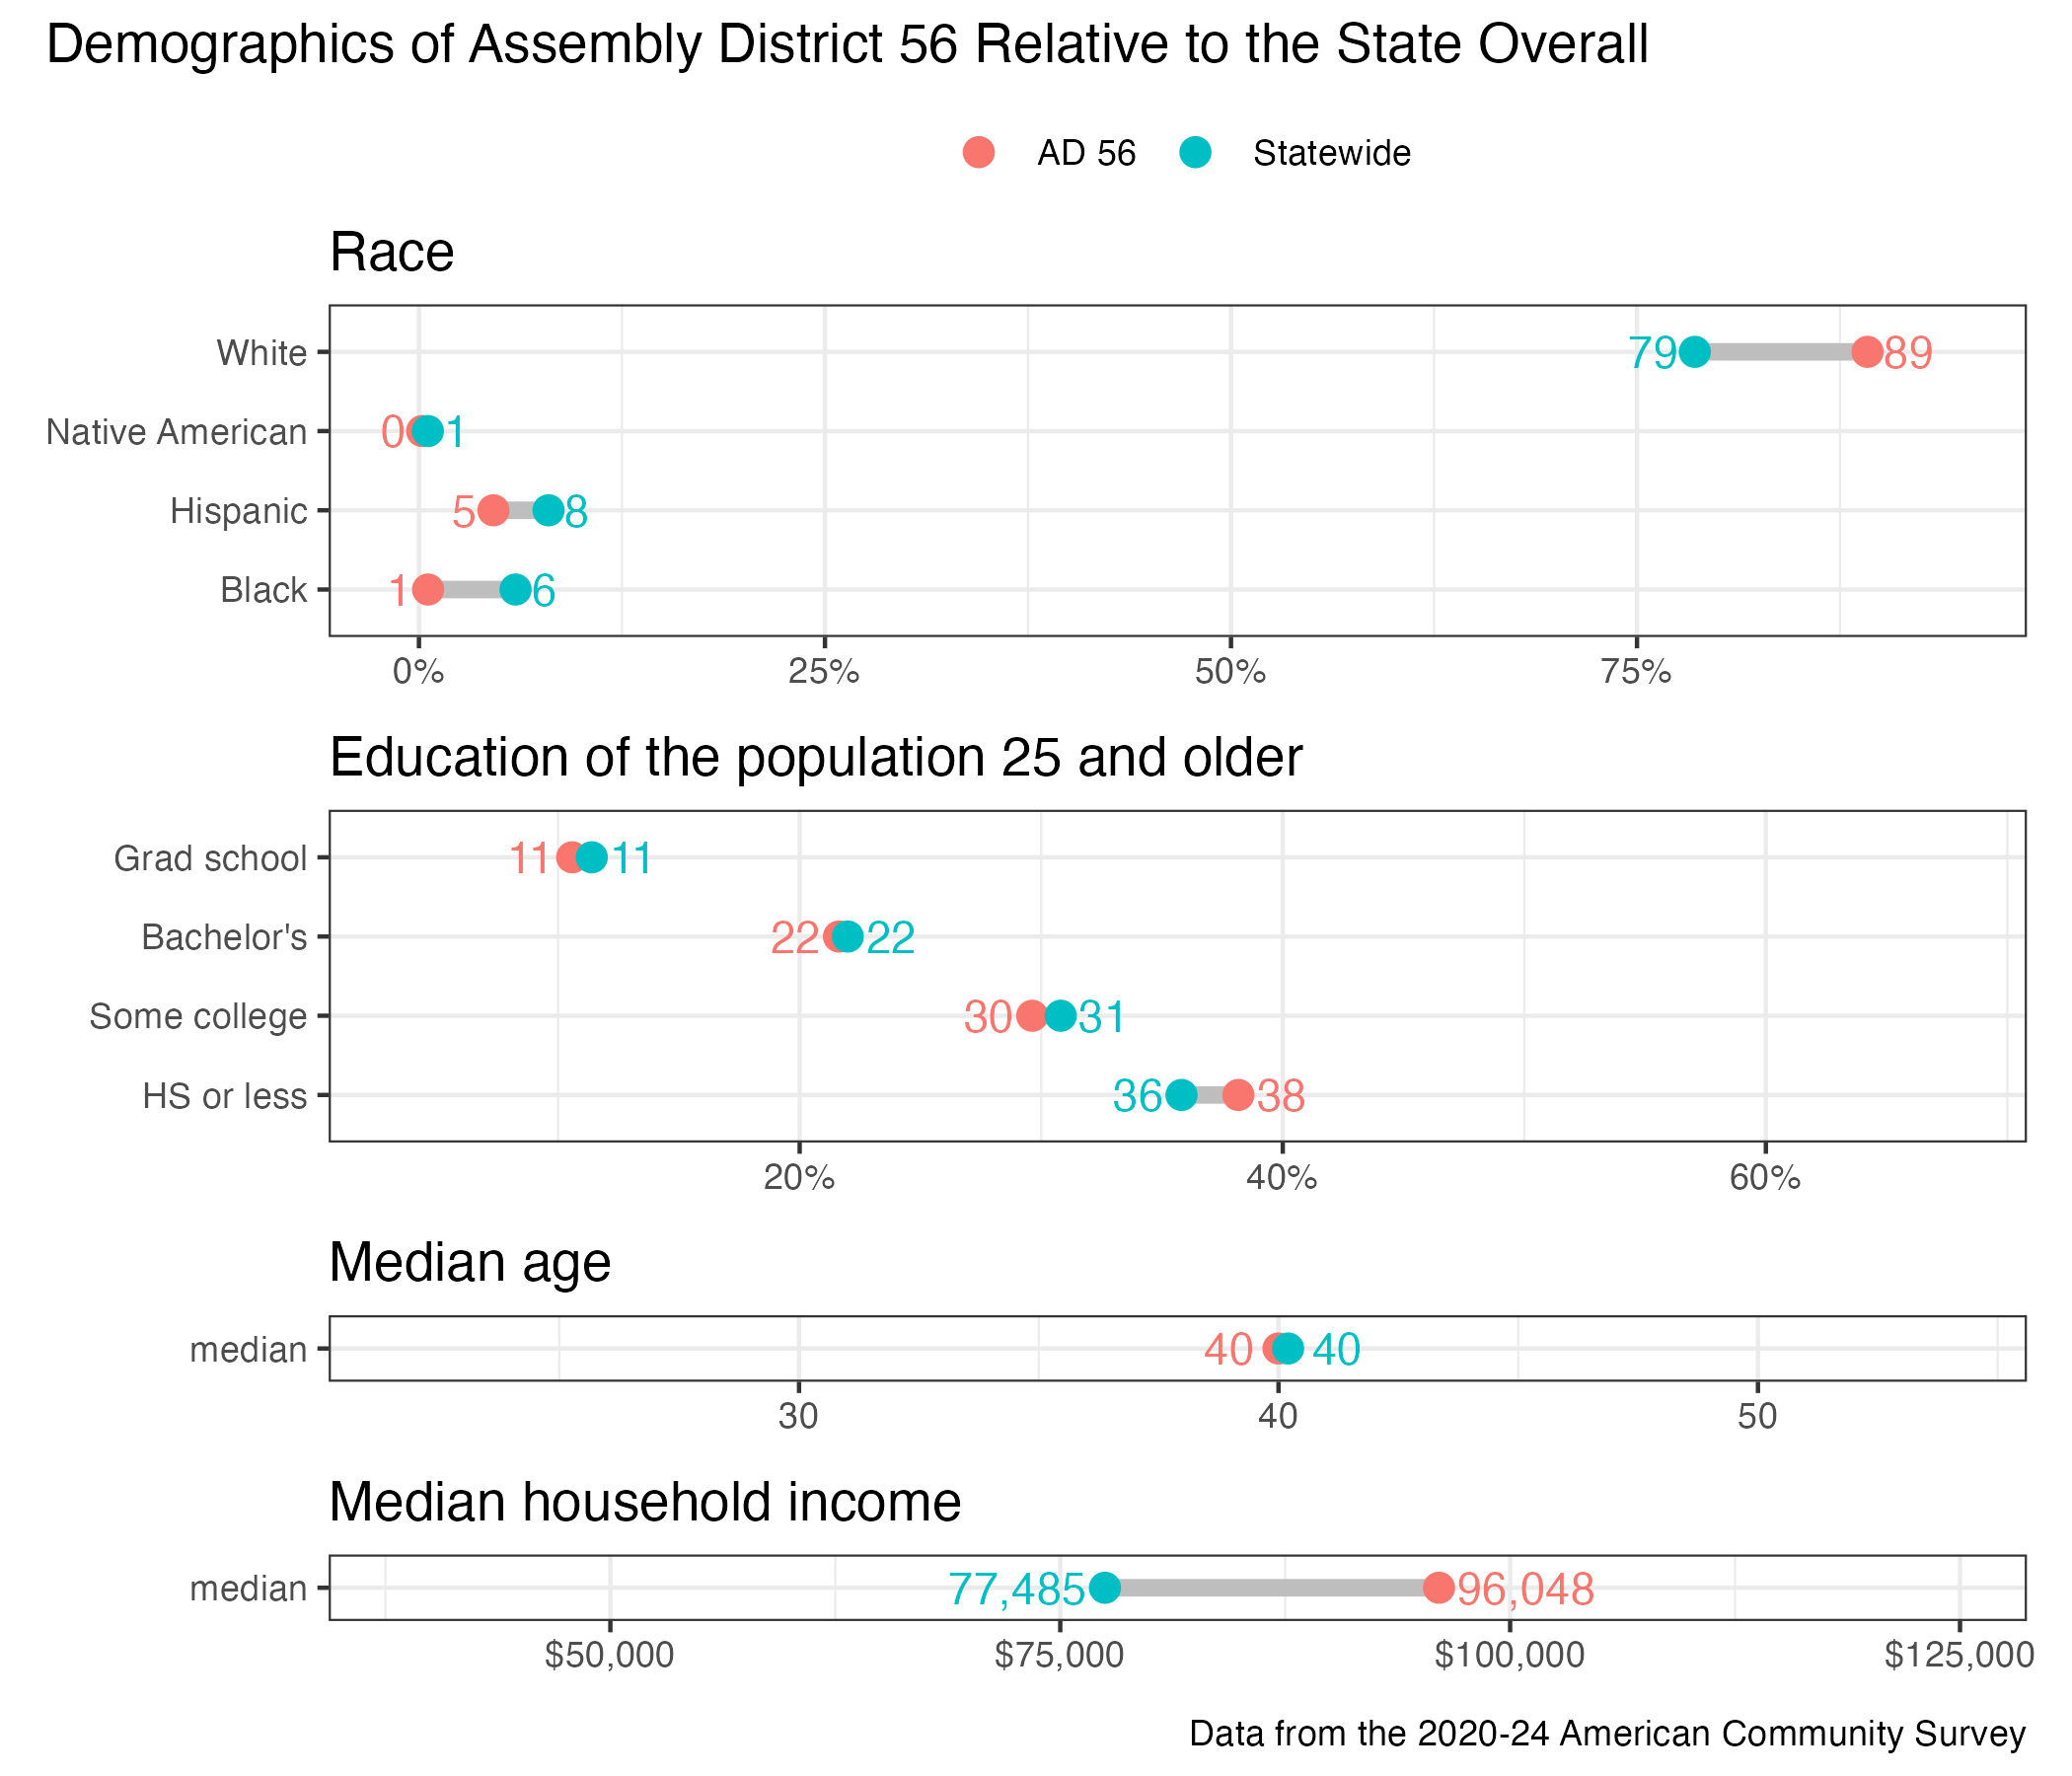
District demographics