7th Senate District
District
Candidates
| Senate District 7 Candidates on the Primary Ballot | ||
| Incumbent: Chris J. Larson | ||
Jan 1 thru July 30
|
||
|---|---|---|
| receipts | disbursements | |
| Republican | ||
| Mike Moeller | $11,989.70 | $9,892.87 |
| Democratic | ||
| Chris J. Larson | $31,329.09 | $24,467.36 |
| Data from the 2026 July Continuing Report. Any amended reports might not yet be shown. | ||
Past election results
| Election Results in Wisconsin State Senate District 7 | ||||||
votes
|
Dem. %1 |
margin (Dem. - Rep.)
|
||||
|---|---|---|---|---|---|---|
| total | Dem. | Rep. | votes | points2 | ||
| 2016 President | 94,002 | 54,256 | 32,766 | 62.3% | +21,490 | +24.7 |
| 2016 Senator | 92,800 | 52,942 | 37,166 | 58.8% | +15,776 | +17.5 |
| 2018 Governor | 86,875 | 53,390 | 31,426 | 62.9% | +21,964 | +25.9 |
| 2018 Senator | 86,520 | 57,847 | 28,473 | 67.0% | +29,374 | +34.0 |
| 2020 President | 101,802 | 64,327 | 35,438 | 64.5% | +28,889 | +29.0 |
| 2022 Governor | 81,455 | 54,901 | 25,761 | 68.1% | +29,140 | +36.1 |
| 2022 Senator | 81,520 | 54,015 | 27,325 | 66.4% | +26,690 | +32.8 |
| 2024 President | 104,920 | 66,143 | 36,427 | 64.5% | +29,716 | +29.0 |
| 2024 Senator | 103,524 | 66,609 | 34,542 | 65.9% | +32,067 | +31.7 |
| 2024 NA | NA | NA | NA | NA | NA | NA |
| 2025 WI Sup. Ct.3 | 74,453 | 54,186 | 20,213 | 72.8% | +33,973 | +45.7 |
| 1 Share of the two-party vote. For Rep. share, subtract from 100. | ||||||
| 2 Dem % of the two-party vote minus Rep % of the two-party vote | ||||||
| 3 Formally nonpartisan candidates assigned party labels based on state endorsements | ||||||
| Election results allocated into 2024 district boundaries based on population overlap. Calculations by John Johnson (johndjohnson.info). | ||||||
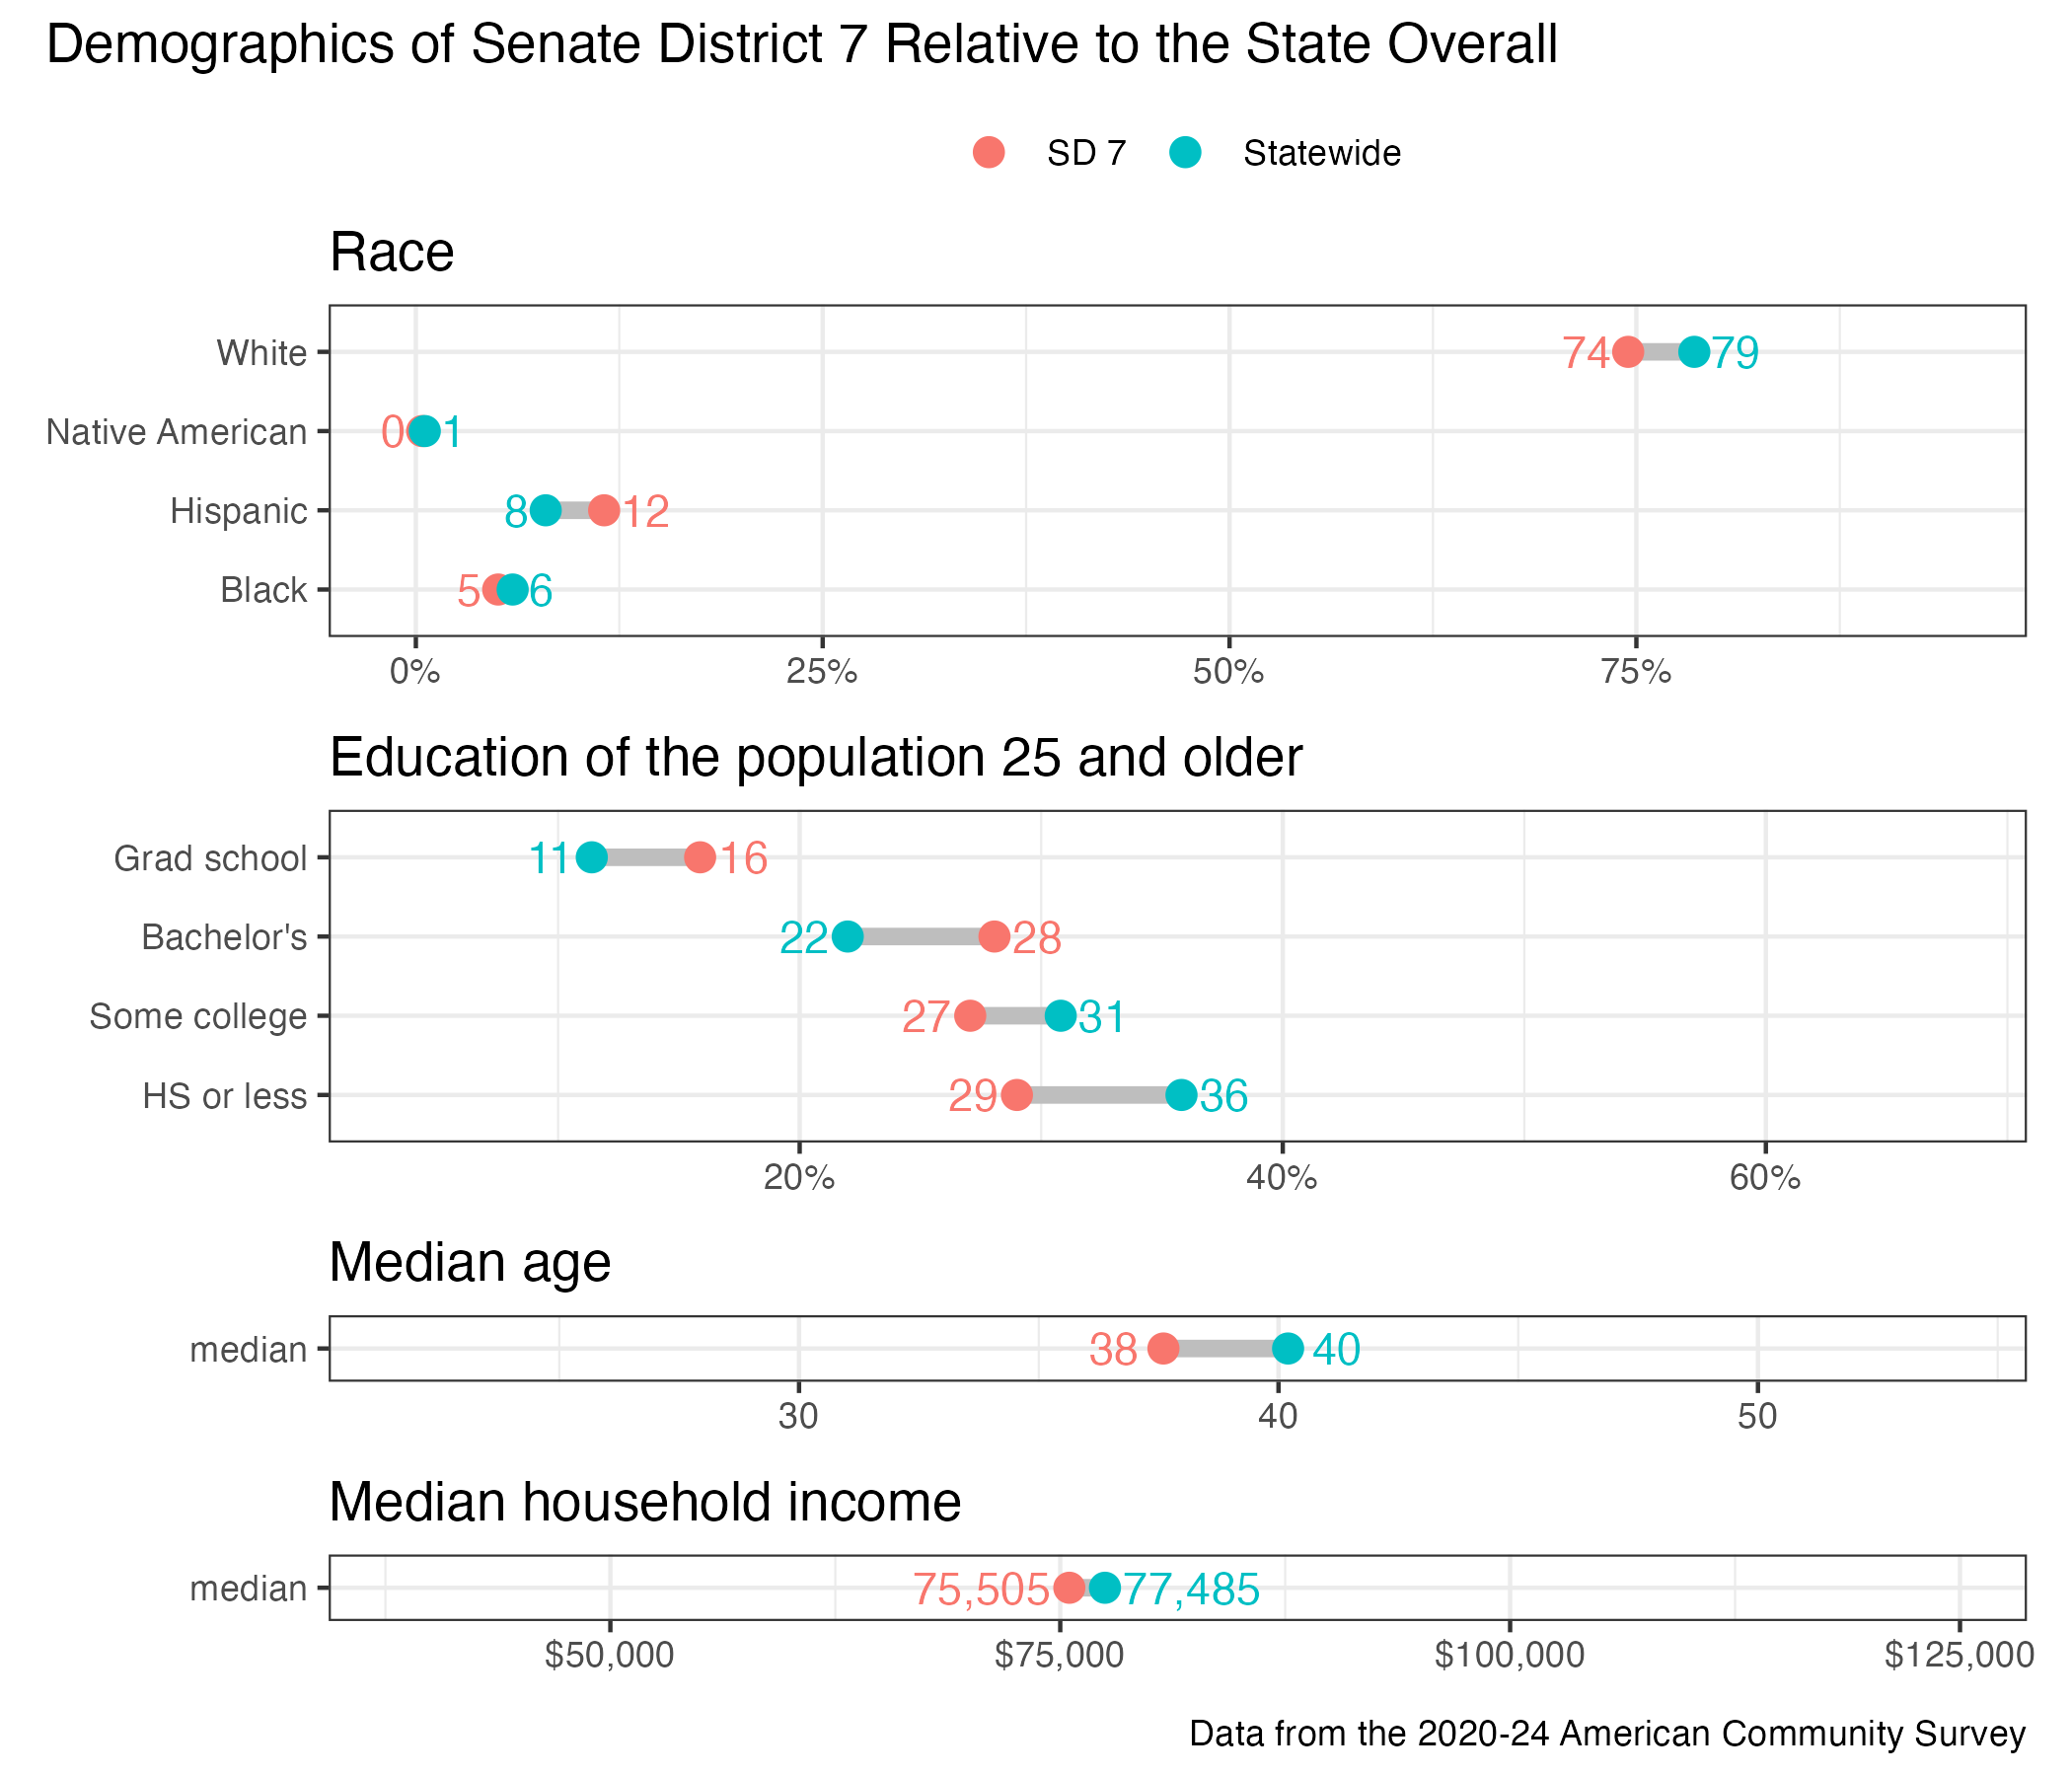
District demographics