68th Assembly District
District
Candidates
| Assembly District 68 Candidates on the Primary Ballot | ||
| Incumbent: Rob Summerfield | ||
Jan 1 thru July 30
|
||
|---|---|---|
| receipts | disbursements | |
| Republican | ||
| Rob Summerfield | $21,581.00 | $23,756.29 |
| Democratic | ||
| Elisha King | $2,289.13 | $208.69 |
| Data from the 2026 July Continuing Report. Any amended reports might not yet be shown. | ||
Past election results
| Election Results in Wisconsin State Assembly District 68 | ||||||
votes
|
Dem. %1 |
margin (Dem. - Rep.)
|
||||
|---|---|---|---|---|---|---|
| total | Dem. | Rep. | votes | points2 | ||
| 2016 President | 30,636 | 9,559 | 19,663 | 32.7% | −10,104 | −34.6 |
| 2016 Senator | 30,379 | 10,634 | 18,455 | 36.6% | −7,821 | −26.9 |
| 2018 Governor | 26,735 | 9,435 | 16,880 | 35.9% | −7,445 | −28.3 |
| 2018 Senator | 26,554 | 11,563 | 14,978 | 43.6% | −3,415 | −12.9 |
| 2020 President | 34,690 | 11,000 | 23,116 | 32.2% | −12,116 | −35.5 |
| 2022 Governor | 28,574 | 9,449 | 18,723 | 33.5% | −9,274 | −32.9 |
| 2022 Senator | 28,413 | 8,826 | 19,557 | 31.1% | −10,731 | −37.8 |
| 2024 President | 36,399 | 11,146 | 24,832 | 31.0% | −13,686 | −38.0 |
| 2024 Senator | 36,087 | 11,519 | 23,584 | 32.8% | −12,065 | −34.4 |
| 2024 WI Assembly | 35,202 | 9,549 | 25,631 | 27.1% | −16,082 | −45.7 |
| 2025 WI Sup. Ct.3 | 25,178 | 9,077 | 16,092 | 36.1% | −7,015 | −27.9 |
| 1 Share of the two-party vote. For Rep. share, subtract from 100. | ||||||
| 2 Dem % of the two-party vote minus Rep % of the two-party vote | ||||||
| 3 Formally nonpartisan candidates assigned party labels based on state endorsements | ||||||
| Election results allocated into 2024 district boundaries based on population overlap. Calculations by John Johnson (johndjohnson.info). | ||||||
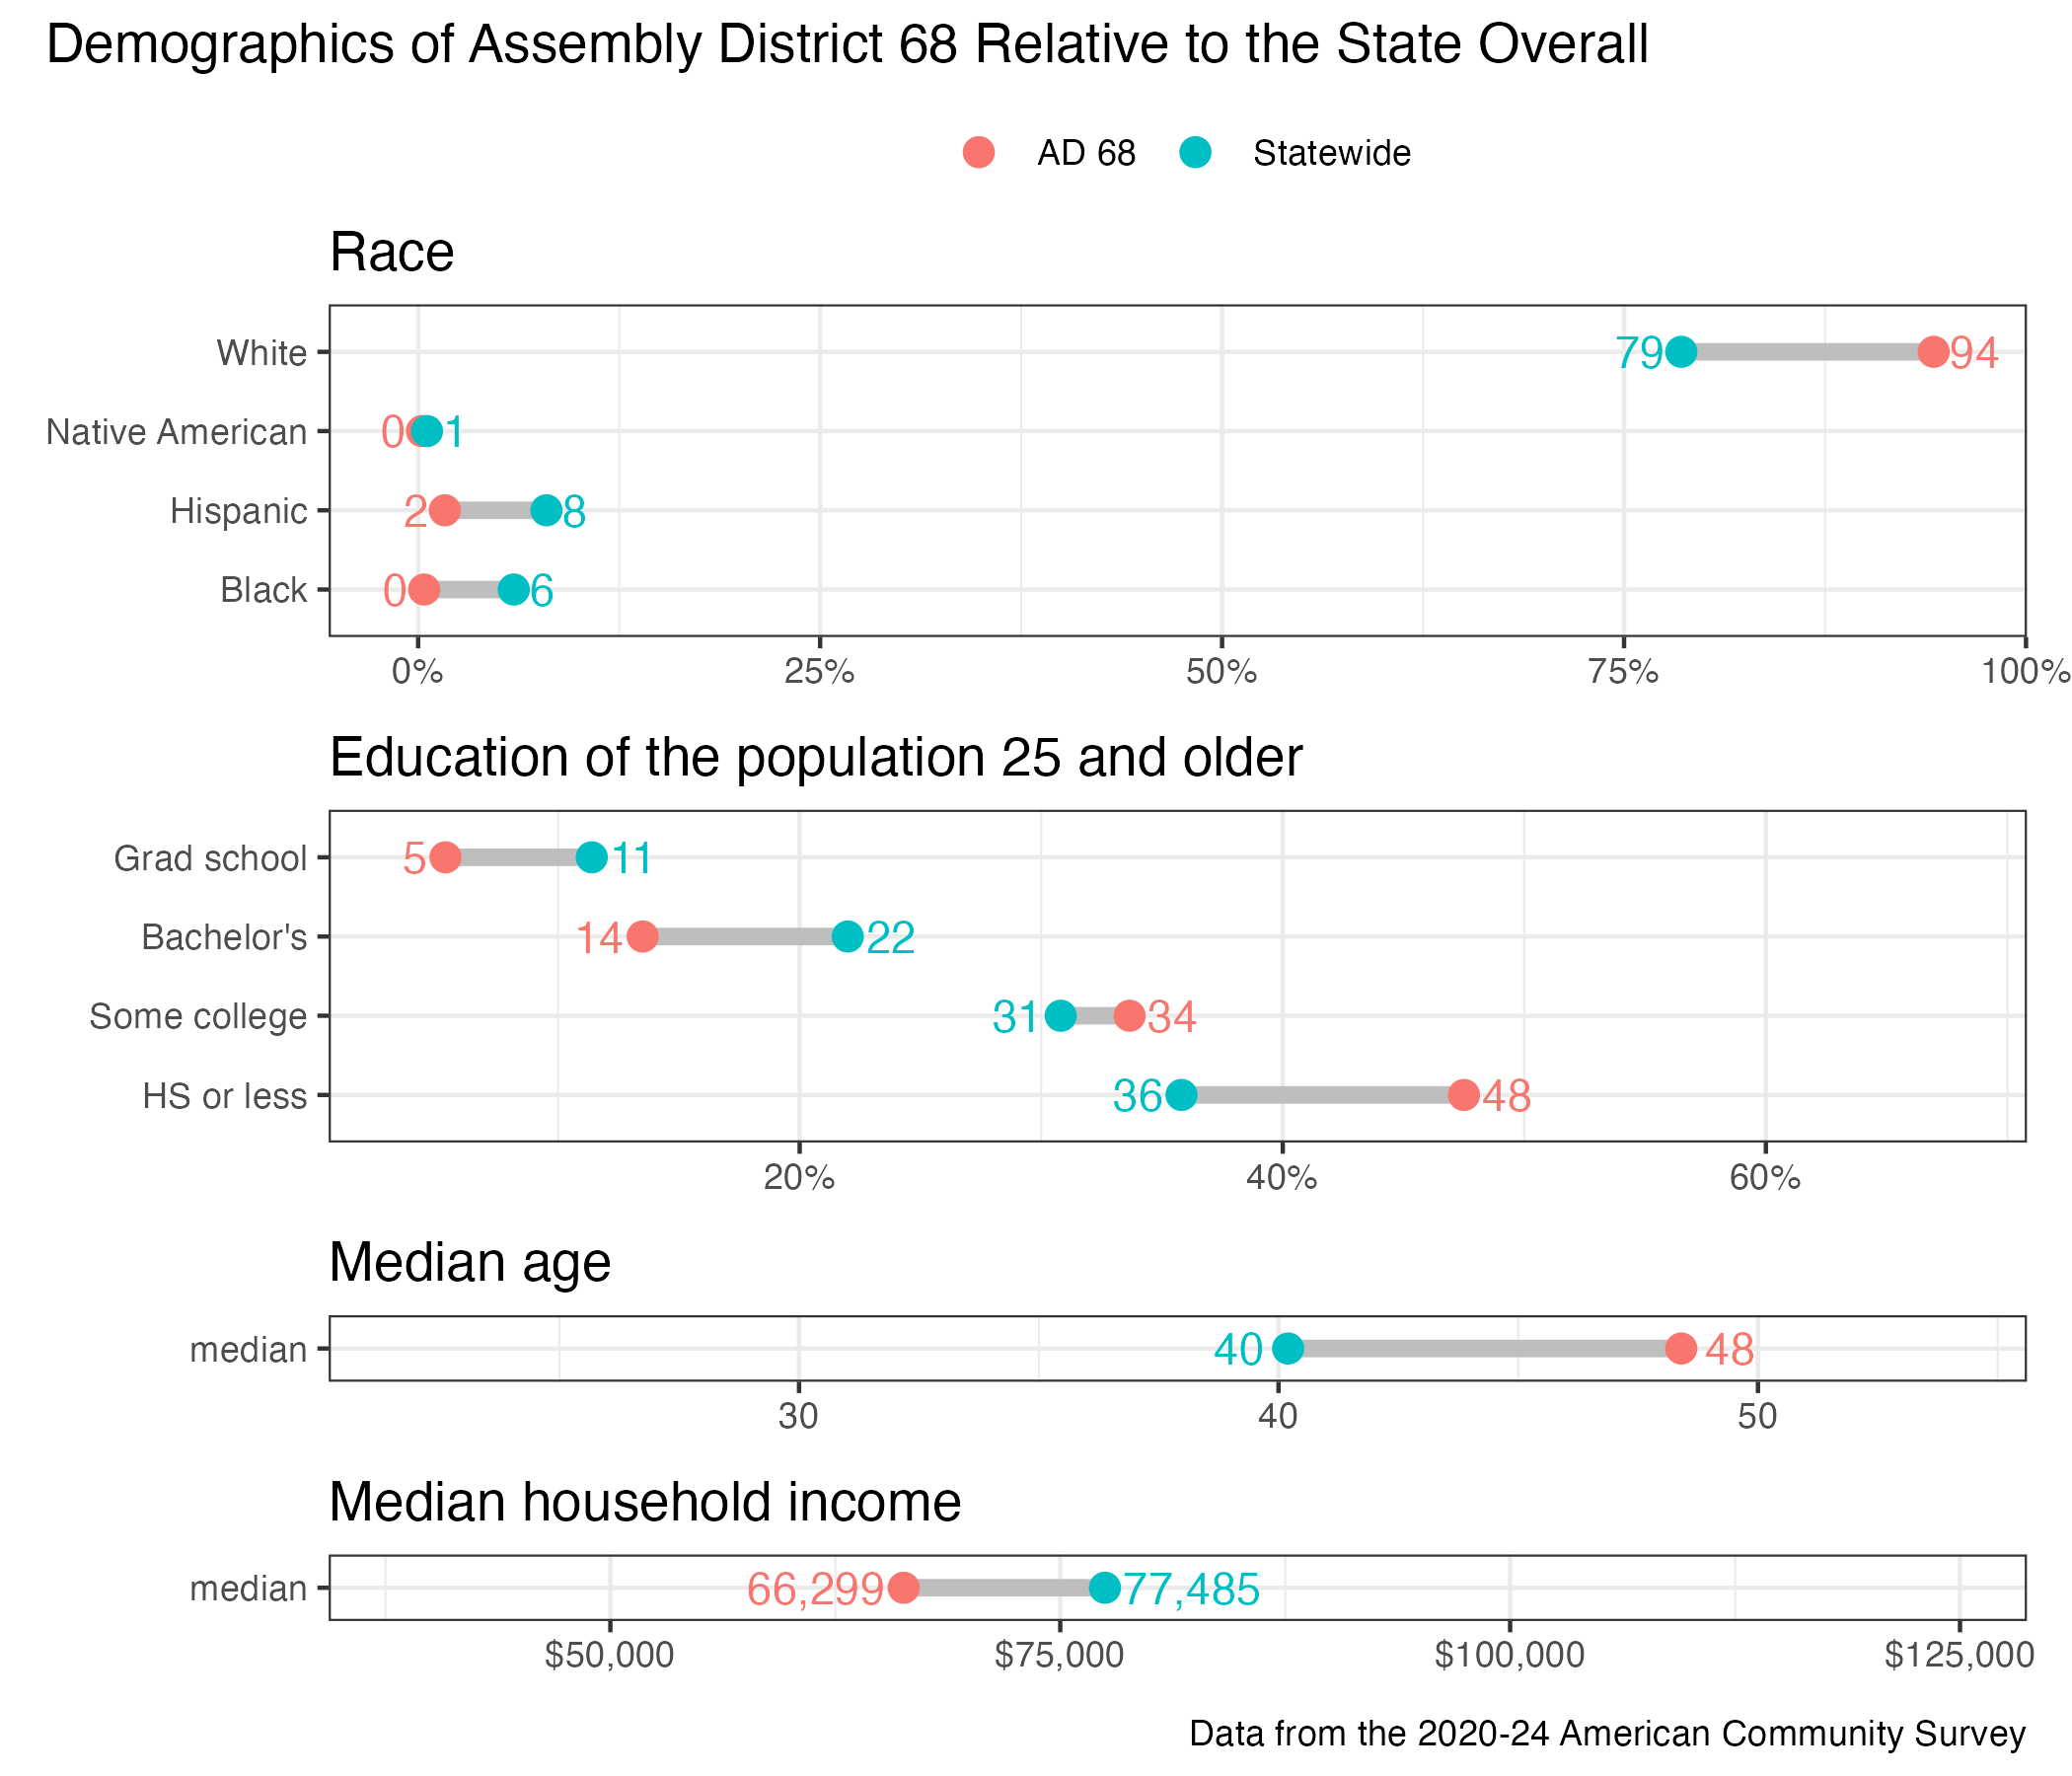
District demographics