2nd Assembly District
District
Candidates
| Assembly District 2 Candidates on the Primary Ballot | ||
| Incumbent: Shae Sortwell | ||
Jan 1 thru July 30
|
||
|---|---|---|
| receipts | disbursements | |
| Republican | ||
| Shae Sortwell | $16,679.22 | $16,518.70 |
| Democratic | ||
| Alicia Saunders | $2,921.00 | $2,089.88 |
| Data from the 2026 July Continuing Report. Any amended reports might not yet be shown. | ||
Past election results
| Election Results in Wisconsin State Assembly District 2 | ||||||
votes
|
Dem. %1 |
margin (Dem. - Rep.)
|
||||
|---|---|---|---|---|---|---|
| total | Dem. | Rep. | votes | points2 | ||
| 2016 President | 30,593 | 10,872 | 17,798 | 37.9% | −6,926 | −24.2 |
| 2016 Senator | 30,319 | 10,573 | 18,664 | 36.2% | −8,091 | −27.7 |
| 2018 Governor | 27,031 | 10,184 | 16,360 | 38.4% | −6,176 | −23.3 |
| 2018 Senator | 26,867 | 12,214 | 14,636 | 45.5% | −2,422 | −9.0 |
| 2020 President | 35,267 | 13,271 | 21,417 | 38.3% | −8,146 | −23.5 |
| 2022 Governor | 29,233 | 11,453 | 17,447 | 39.6% | −5,994 | −20.7 |
| 2022 Senator | 29,133 | 10,884 | 18,221 | 37.4% | −7,337 | −25.2 |
| 2024 President | 37,971 | 14,233 | 23,163 | 38.1% | −8,930 | −23.9 |
| 2024 Senator | 37,706 | 14,251 | 22,541 | 38.7% | −8,290 | −22.5 |
| 2024 WI Assembly | 36,693 | 13,474 | 23,198 | 36.7% | −9,724 | −26.5 |
| 2025 WI Sup. Ct.3 | 25,476 | 11,160 | 14,308 | 43.8% | −3,148 | −12.4 |
| 1 Share of the two-party vote. For Rep. share, subtract from 100. | ||||||
| 2 Dem % of the two-party vote minus Rep % of the two-party vote | ||||||
| 3 Formally nonpartisan candidates assigned party labels based on state endorsements | ||||||
| Election results allocated into 2024 district boundaries based on population overlap. Calculations by John Johnson (johndjohnson.info). | ||||||
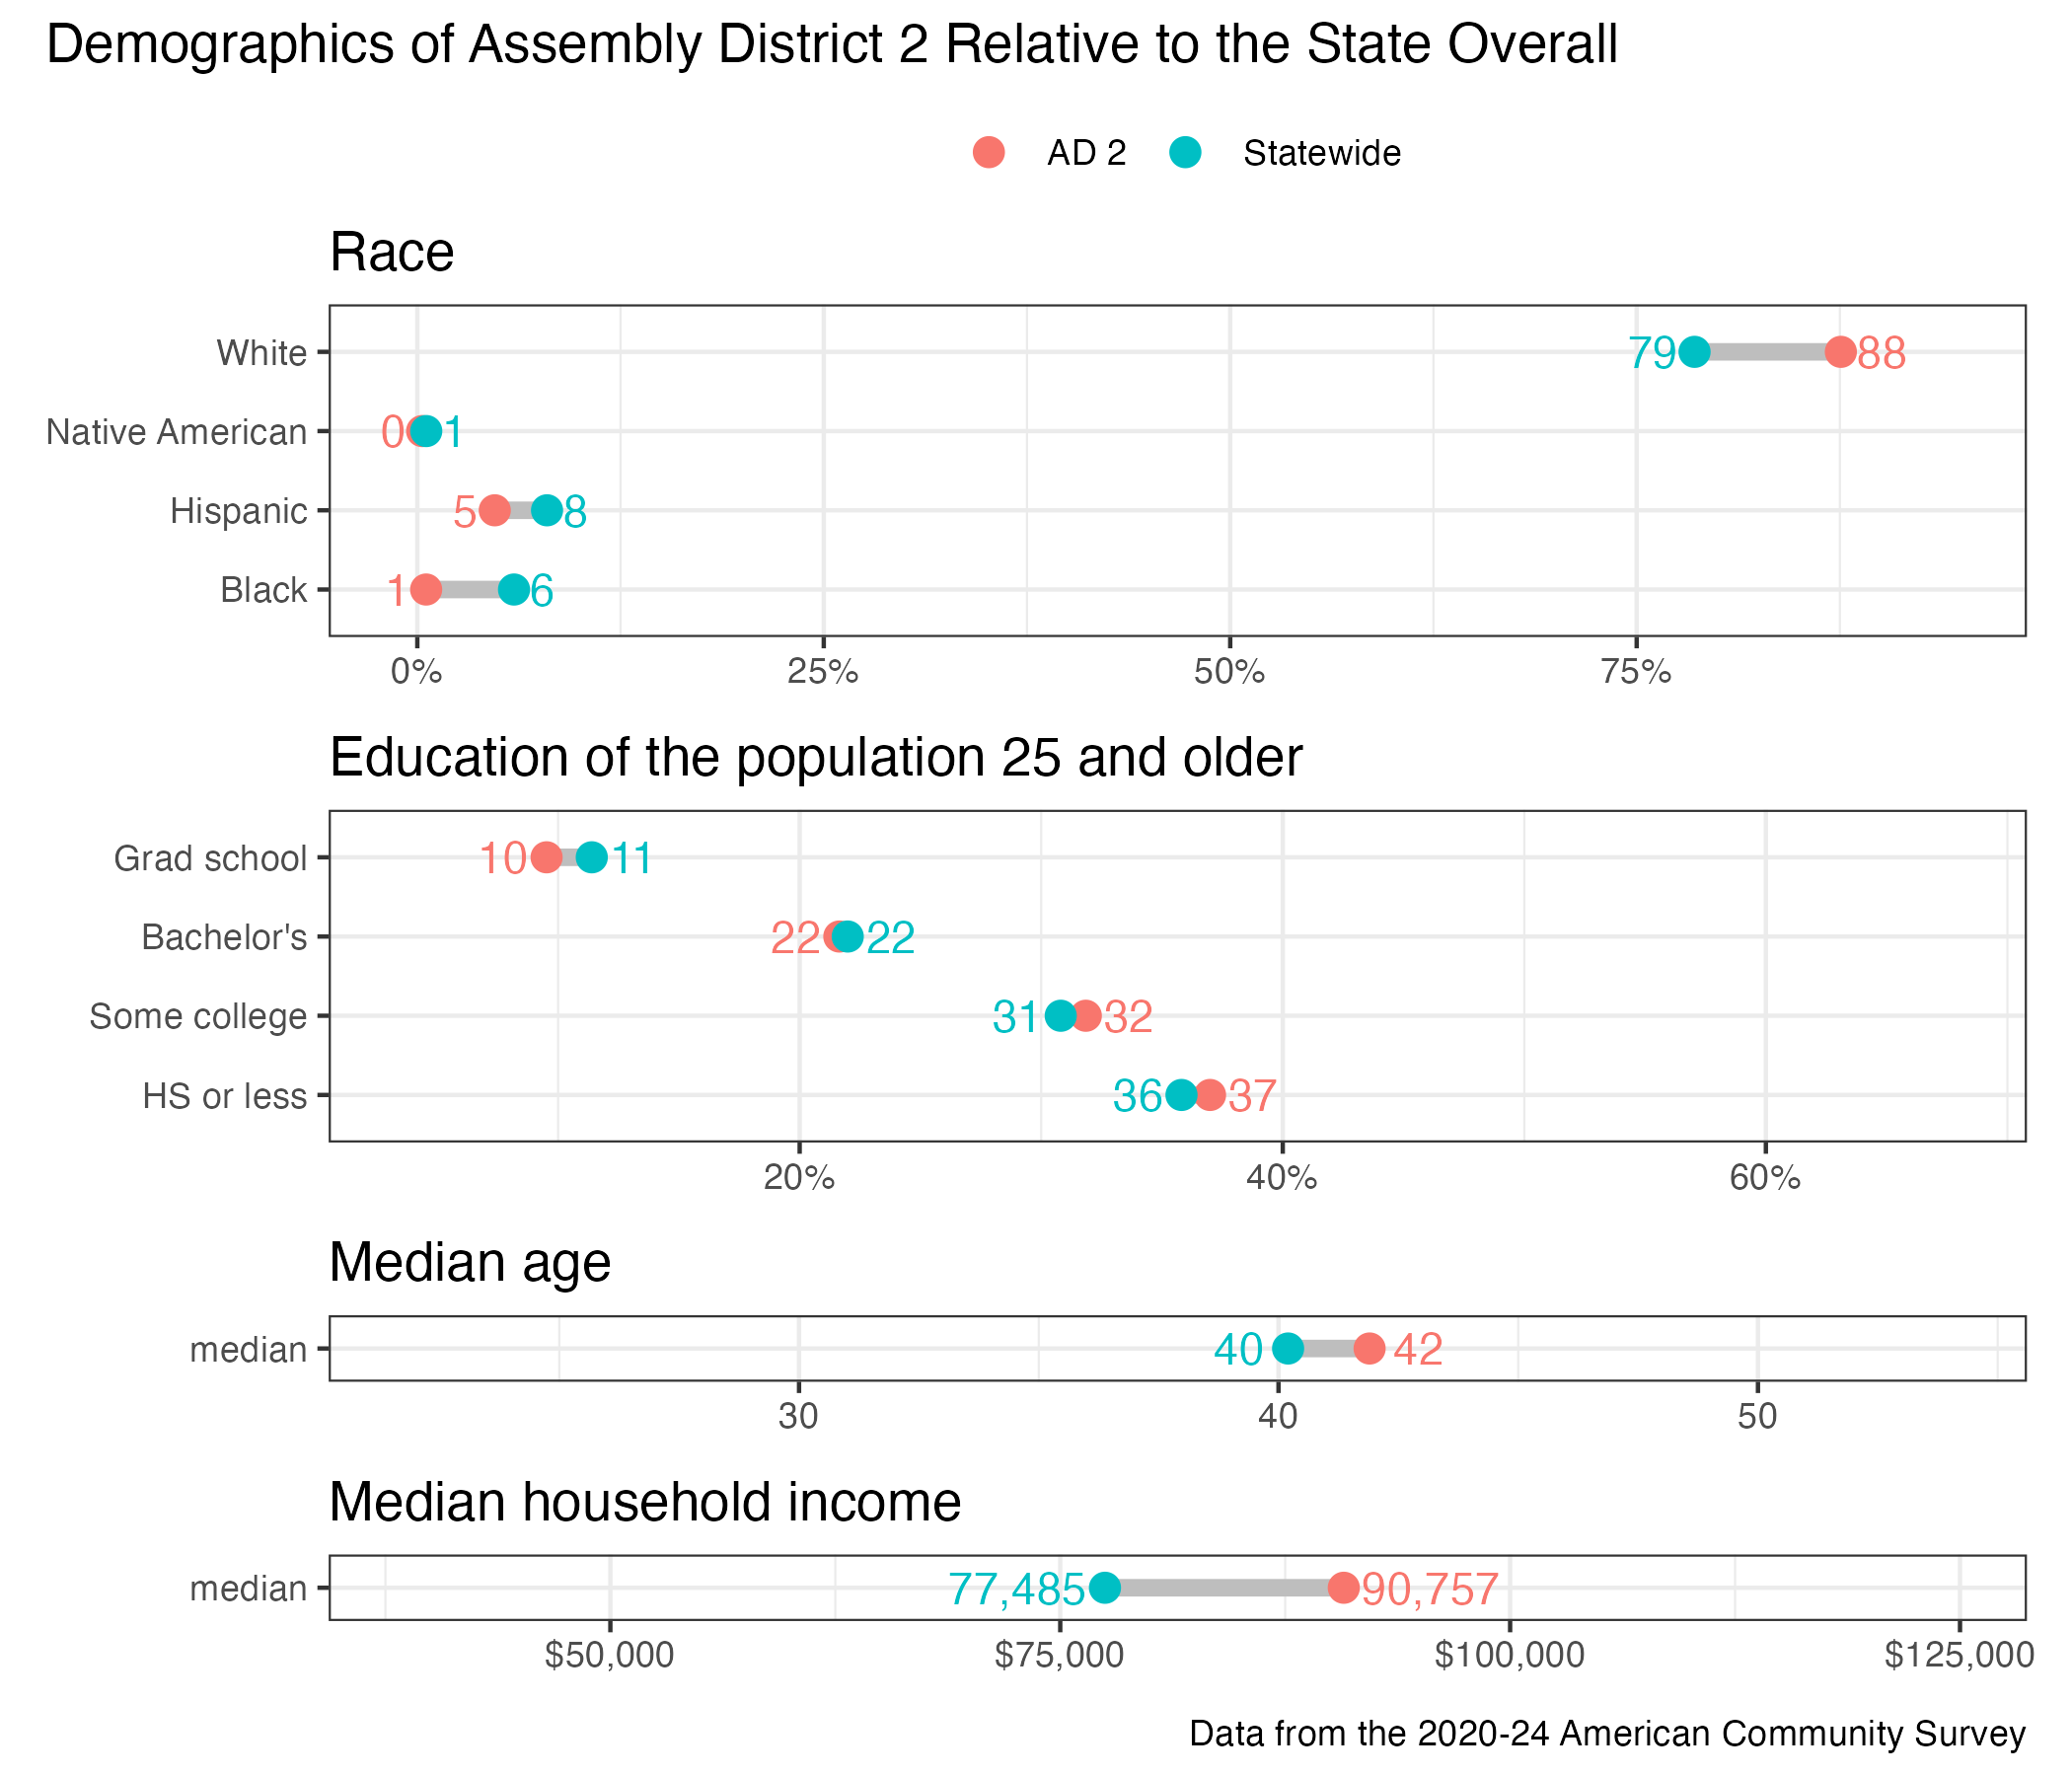
District demographics