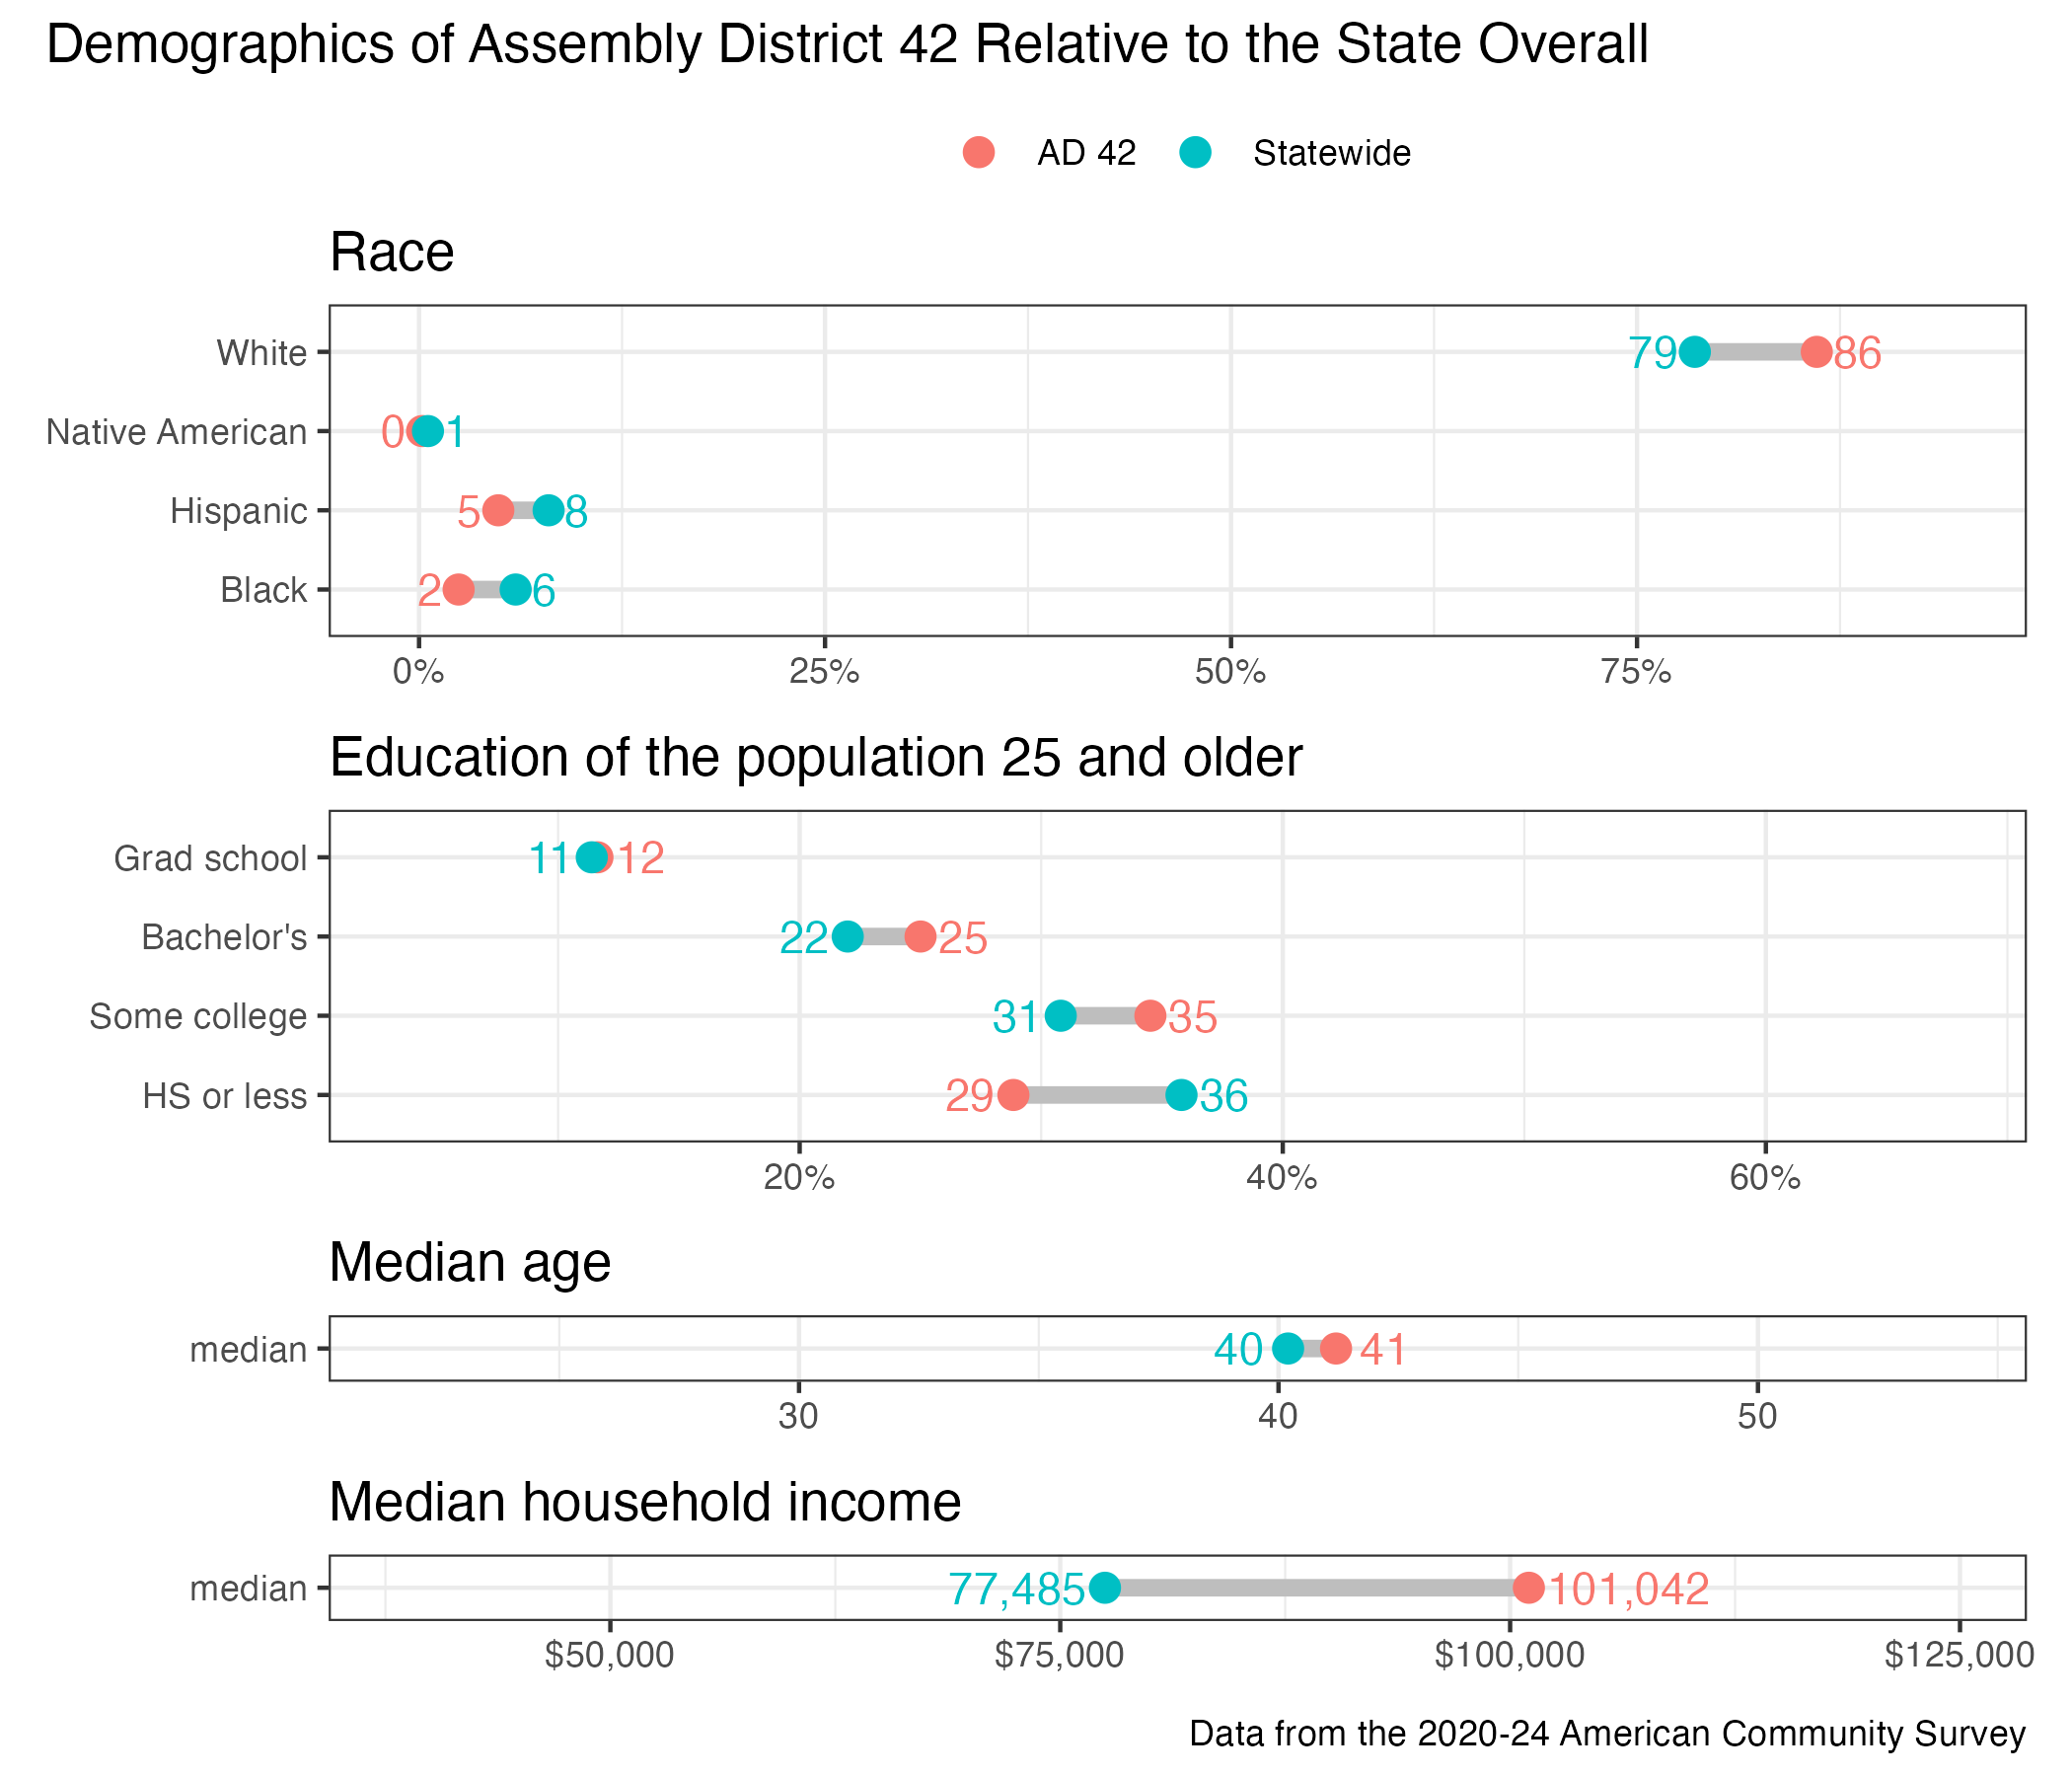
42nd Assembly District
District
Candidates
| Assembly District 42 Candidates on the Primary Ballot | ||
| Incumbent: Maureen McCarville | ||
Jan 1 thru July 30
|
||
|---|---|---|
| receipts | disbursements | |
| Republican | ||
| Keith F. Miller | $100.00 | $118.14 |
| Democratic | ||
| Maureen McCarville | $13,315.00 | $1,185.91 |
| Data from the 2026 July Continuing Report. Any amended reports might not yet be shown. | ||
Past election results
| Election Results in Wisconsin State Assembly District 42 | ||||||
votes
|
Dem. %1 |
margin (Dem. - Rep.)
|
||||
|---|---|---|---|---|---|---|
| total | Dem. | Rep. | votes | points2 | ||
| 2016 President | 29,982 | 15,913 | 11,967 | 57.1% | +3,946 | +14.2 |
| 2016 Senator | 29,741 | 16,999 | 11,957 | 58.7% | +5,042 | +17.4 |
| 2018 Governor | 28,304 | 16,831 | 10,925 | 60.6% | +5,906 | +21.3 |
| 2018 Senator | 28,191 | 17,824 | 10,333 | 63.3% | +7,491 | +26.6 |
| 2020 President | 35,902 | 20,545 | 14,767 | 58.2% | +5,778 | +16.4 |
| 2022 Governor | 30,251 | 18,285 | 11,687 | 61.0% | +6,598 | +22.0 |
| 2022 Senator | 30,131 | 17,554 | 12,505 | 58.4% | +5,049 | +16.8 |
| 2024 President | 38,645 | 21,888 | 16,131 | 57.6% | +5,757 | +15.1 |
| 2024 Senator | 38,355 | 21,977 | 15,673 | 58.4% | +6,304 | +16.7 |
| 2024 WI Assembly | 37,086 | 20,400 | 16,648 | 55.1% | +3,752 | +10.1 |
| 2025 WI Sup. Ct.3 | 27,762 | 17,944 | 9,796 | 64.7% | +8,148 | +29.4 |
| 1 Share of the two-party vote. For Rep. share, subtract from 100. | ||||||
| 2 Dem % of the two-party vote minus Rep % of the two-party vote | ||||||
| 3 Formally nonpartisan candidates assigned party labels based on state endorsements | ||||||
| Election results allocated into 2024 district boundaries based on population overlap. Calculations by John Johnson (johndjohnson.info). | ||||||
District demographics