24th Assembly District
District
Candidates
| Assembly District 24 Candidates on the Primary Ballot | ||
| Incumbent: Dan Knodl | ||
Jan 1 thru July 30
|
||
|---|---|---|
| receipts | disbursements | |
| Republican | ||
| Dan Knodl | $3,860.00 | $8,214.15 |
| Democratic | ||
| Matt Brown | $1,130.00 | $596.55 |
| Data from the 2026 July Continuing Report. Any amended reports might not yet be shown. | ||
Past election results
| Election Results in Wisconsin State Assembly District 24 | ||||||
votes
|
Dem. %1 |
margin (Dem. - Rep.)
|
||||
|---|---|---|---|---|---|---|
| total | Dem. | Rep. | votes | points2 | ||
| 2016 President | 34,567 | 12,149 | 20,132 | 37.6% | −7,983 | −24.7 |
| 2016 Senator | 34,682 | 10,906 | 23,077 | 32.1% | −12,171 | −35.8 |
| 2018 Governor | 32,397 | 10,918 | 21,039 | 34.2% | −10,121 | −31.7 |
| 2018 Senator | 32,217 | 13,130 | 19,049 | 40.8% | −5,919 | −18.4 |
| 2020 President | 39,119 | 16,306 | 22,132 | 42.4% | −5,826 | −15.2 |
| 2022 Governor | 32,995 | 14,258 | 18,462 | 43.6% | −4,204 | −12.8 |
| 2022 Senator | 32,942 | 13,461 | 19,440 | 40.9% | −5,979 | −18.2 |
| 2024 President | 40,800 | 18,051 | 22,074 | 45.0% | −4,023 | −10.0 |
| 2024 Senator | 40,501 | 17,625 | 22,208 | 44.2% | −4,583 | −11.5 |
| 2024 WI Assembly | 39,806 | 15,887 | 23,858 | 40.0% | −7,971 | −20.1 |
| 2025 WI Sup. Ct.3 | 29,256 | 13,809 | 15,430 | 47.2% | −1,621 | −5.5 |
| 1 Share of the two-party vote. For Rep. share, subtract from 100. | ||||||
| 2 Dem % of the two-party vote minus Rep % of the two-party vote | ||||||
| 3 Formally nonpartisan candidates assigned party labels based on state endorsements | ||||||
| Election results allocated into 2024 district boundaries based on population overlap. Calculations by John Johnson (johndjohnson.info). | ||||||
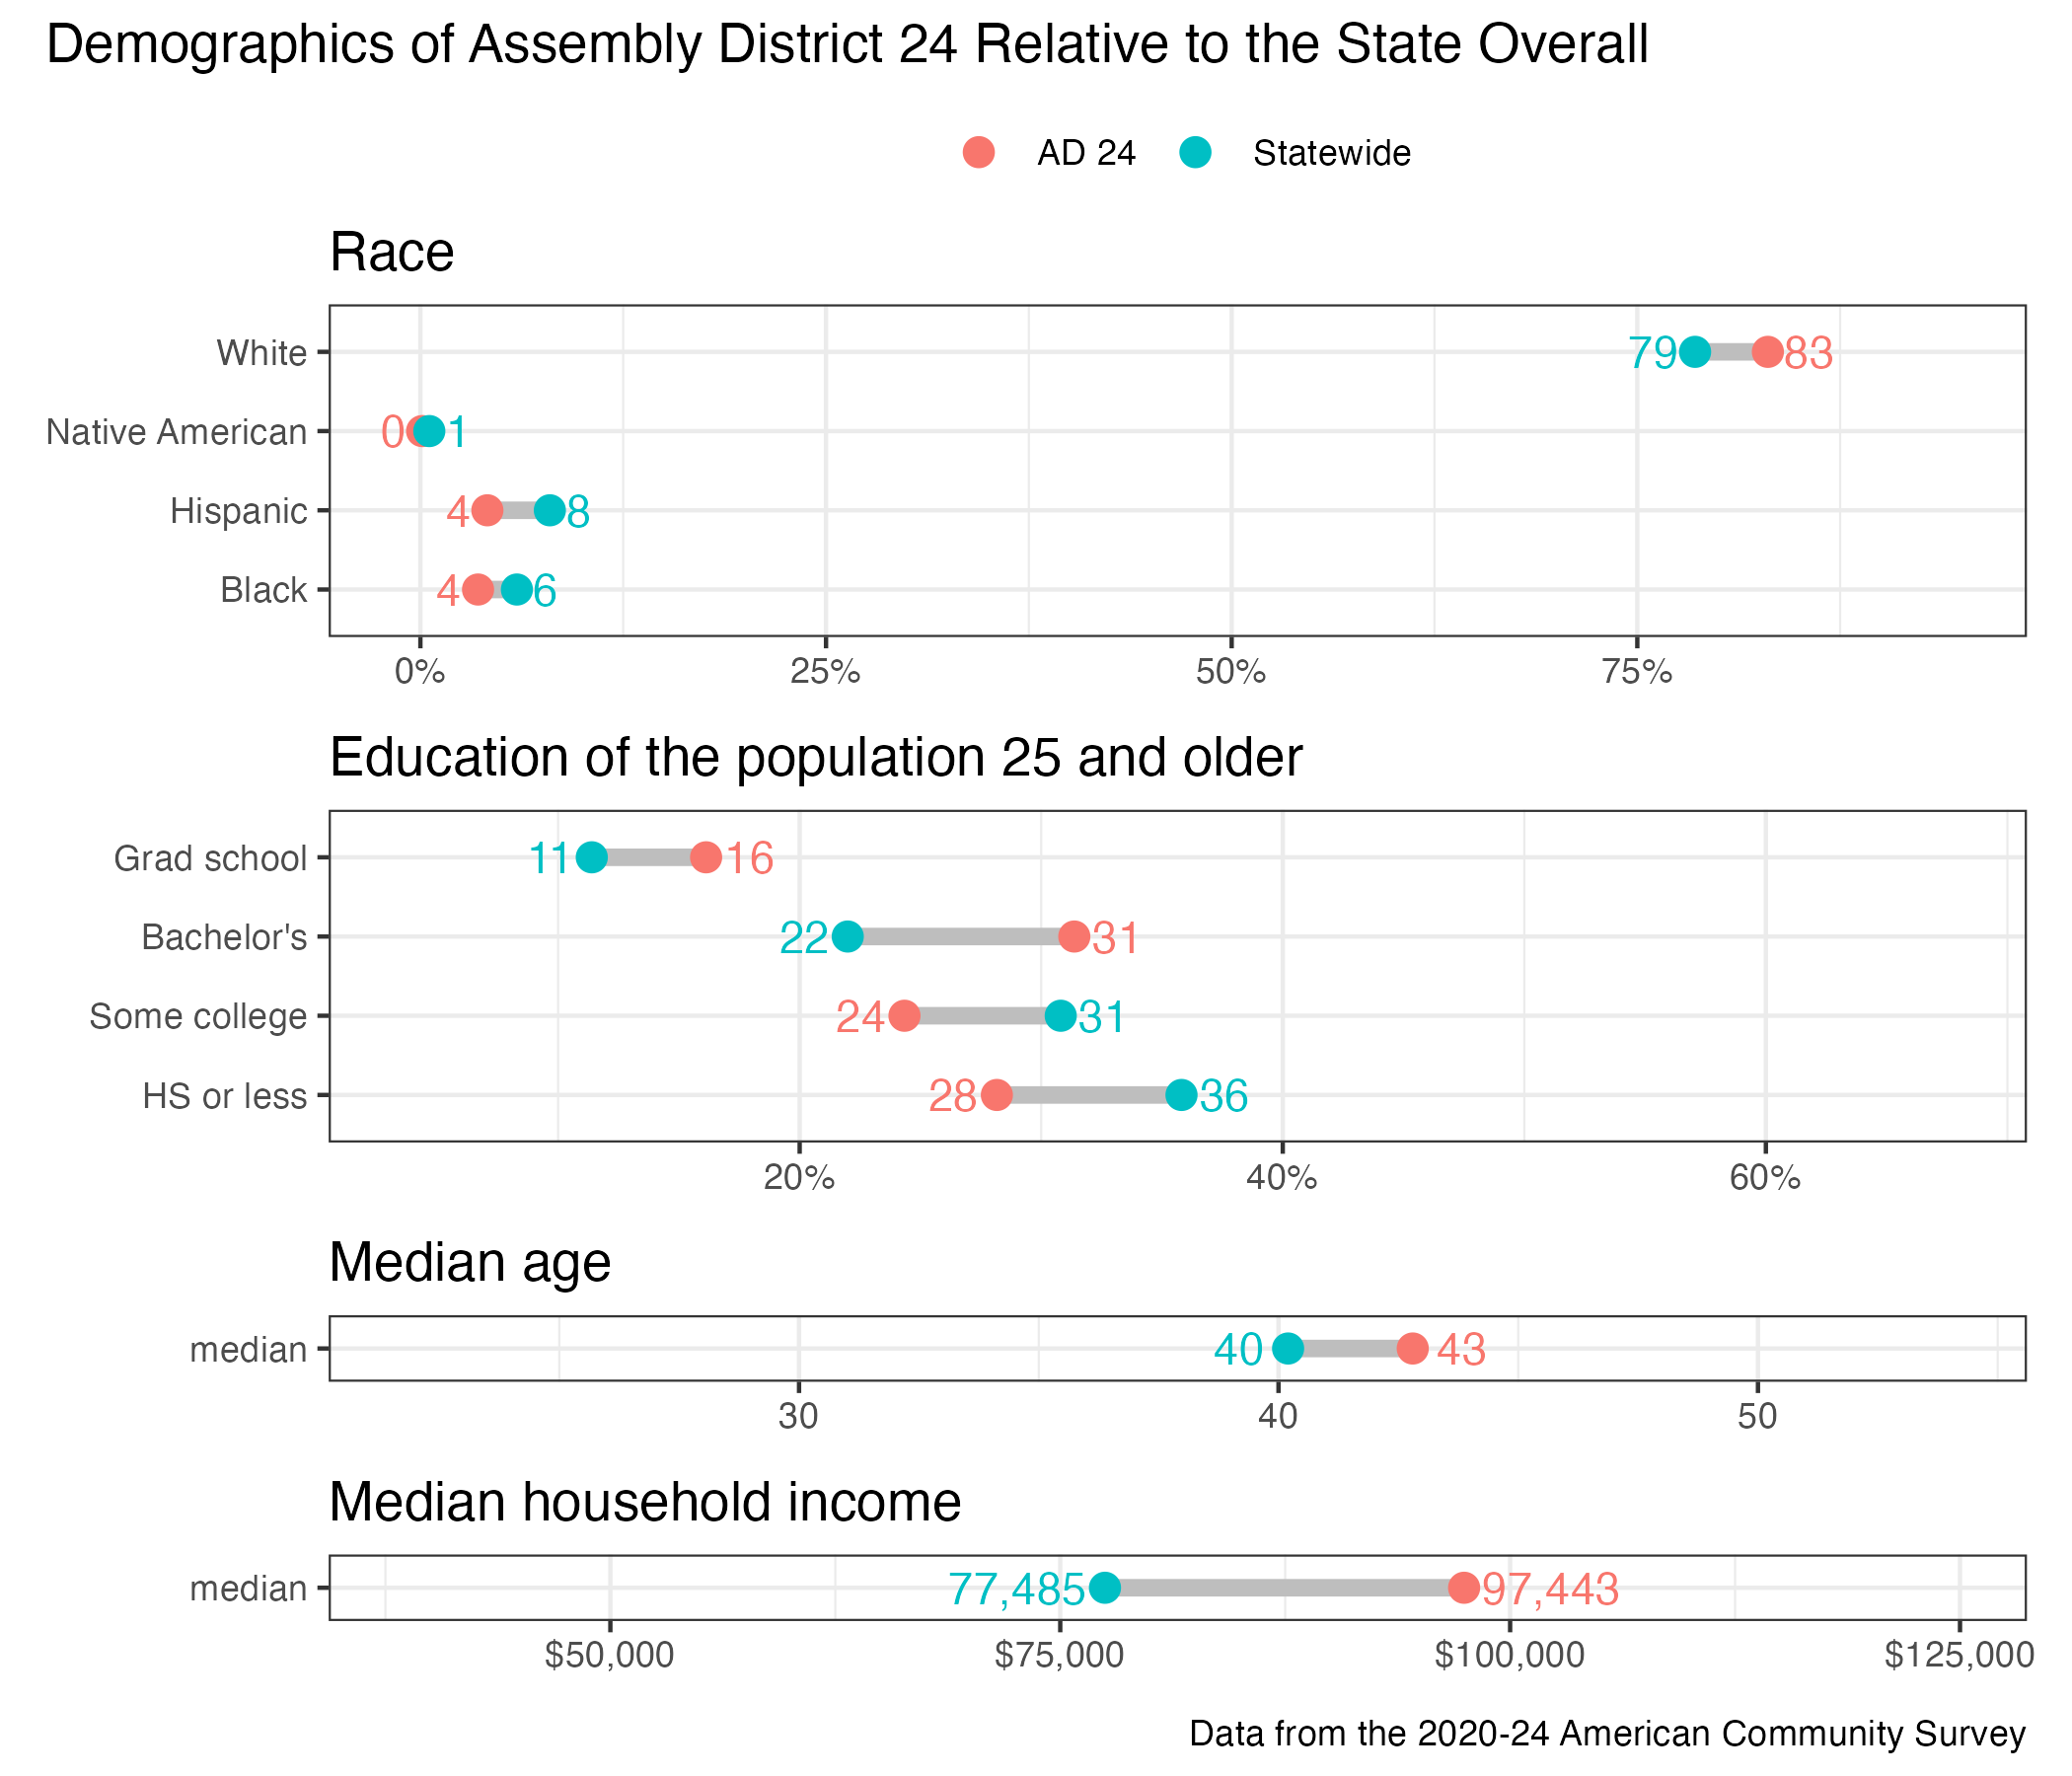
District demographics