93rd Assembly District
District
Candidates
| Assembly District 93 Candidates on the Primary Ballot | ||
| Incumbent: Christian Phelps | ||
Jan 1 thru July 30
|
||
|---|---|---|
| receipts | disbursements | |
| Republican | ||
| Michael Ayala | $0.00 | $0.00 |
| Democratic | ||
| Christian Phelps | $33,449.25 | $4,724.67 |
| Data from the 2026 July Continuing Report. Any amended reports might not yet be shown. | ||
Past election results
| Election Results in Wisconsin State Assembly District 93 | ||||||
votes
|
Dem. %1 |
margin (Dem. - Rep.)
|
||||
|---|---|---|---|---|---|---|
| total | Dem. | Rep. | votes | points2 | ||
| 2016 President | 31,854 | 15,805 | 13,564 | 53.8% | +2,241 | +7.6 |
| 2016 Senator | 31,281 | 15,834 | 14,341 | 52.5% | +1,493 | +4.9 |
| 2018 Governor | 27,431 | 14,948 | 11,857 | 55.8% | +3,091 | +11.5 |
| 2018 Senator | 27,340 | 16,521 | 10,785 | 60.5% | +5,736 | +21.0 |
| 2020 President | 32,422 | 17,207 | 14,511 | 54.3% | +2,696 | +8.5 |
| 2022 Governor | 27,503 | 15,592 | 11,611 | 57.3% | +3,981 | +14.6 |
| 2022 Senator | 27,258 | 14,836 | 12,371 | 54.5% | +2,465 | +9.1 |
| 2024 President | 36,032 | 19,236 | 16,249 | 54.2% | +2,987 | +8.4 |
| 2024 Senator | 35,577 | 19,161 | 15,623 | 55.1% | +3,538 | +10.2 |
| 2024 WI Assembly | 35,044 | 18,474 | 16,527 | 52.8% | +1,947 | +5.6 |
| 2025 WI Sup. Ct.3 | 25,084 | 15,516 | 9,552 | 61.9% | +5,964 | +23.8 |
| 1 Share of the two-party vote. For Rep. share, subtract from 100. | ||||||
| 2 Dem % of the two-party vote minus Rep % of the two-party vote | ||||||
| 3 Formally nonpartisan candidates assigned party labels based on state endorsements | ||||||
| Election results allocated into 2024 district boundaries based on population overlap. Calculations by John Johnson (johndjohnson.info). | ||||||
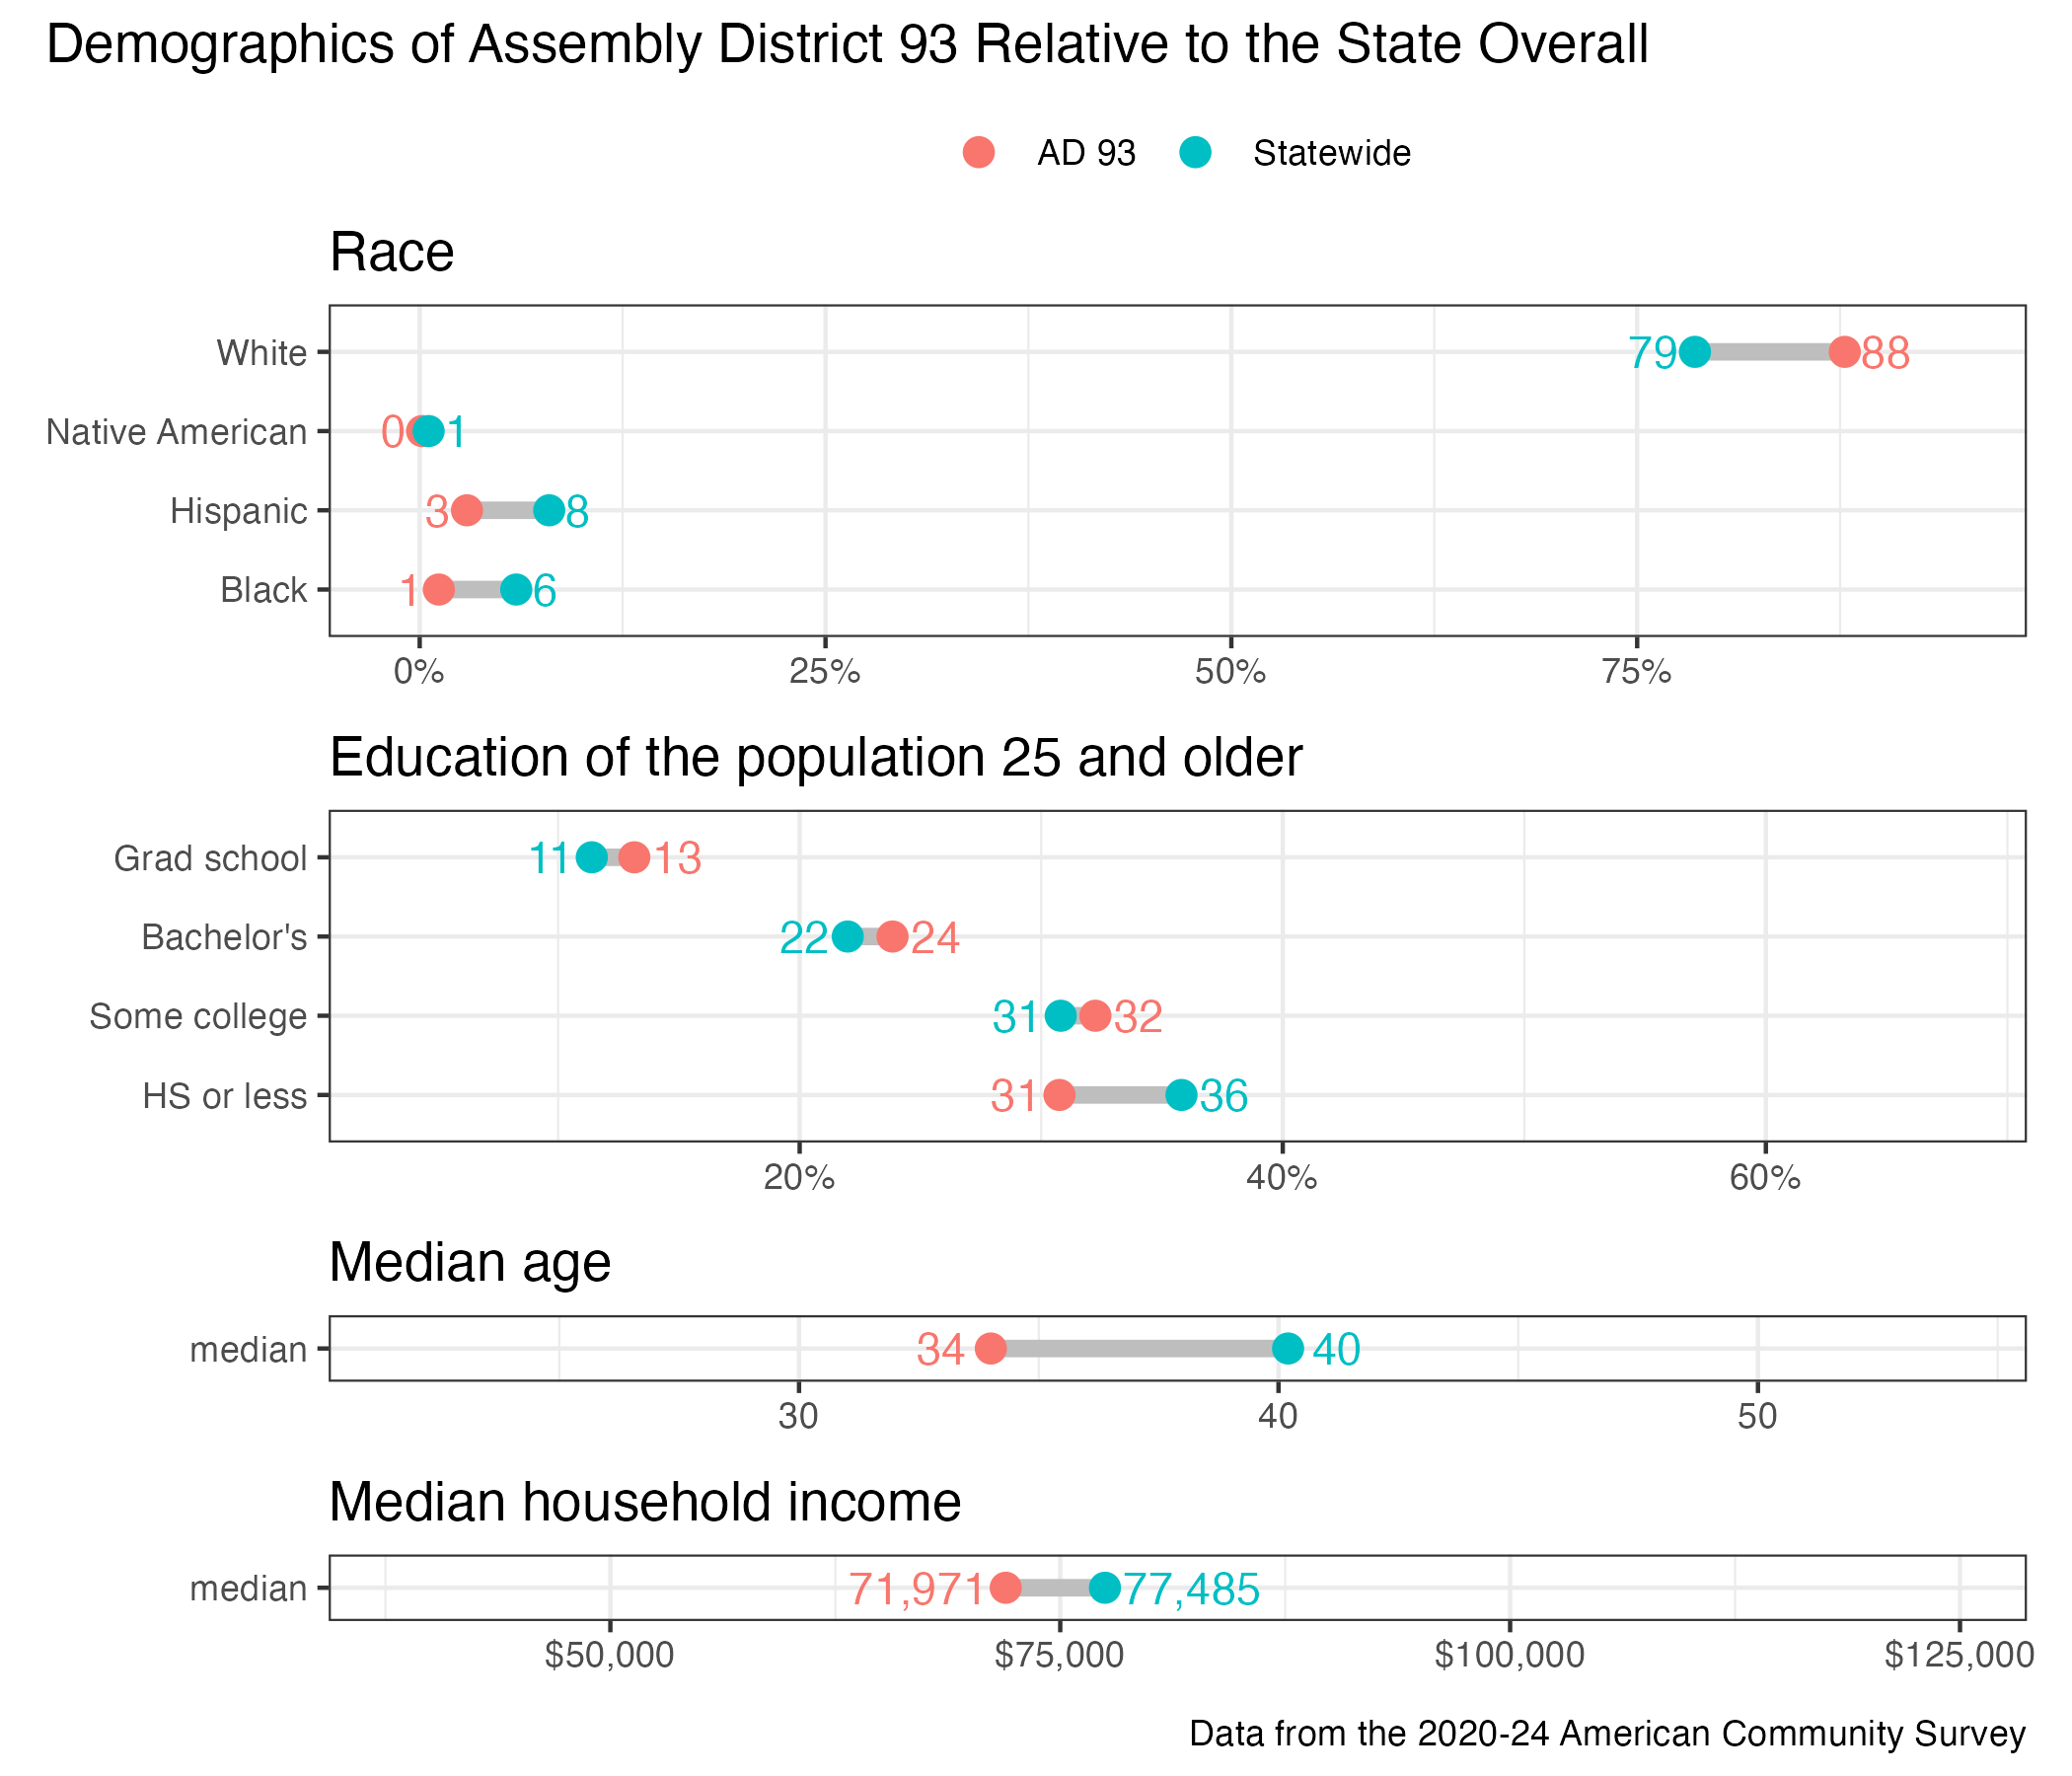
District demographics