30th Assembly District
District
Candidates
| Assembly District 30 Candidates on the Primary Ballot | ||
| Incumbent: Shannon Zimmerman | ||
Jan 1 thru July 30
|
||
|---|---|---|
| receipts | disbursements | |
| Republican | ||
| Shannon Zimmerman | $29,215.00 | $22,315.66 |
| Democratic | ||
| Kevin Knoke | $65,550.27 | $10,769.25 |
| Data from the 2026 July Continuing Report. Any amended reports might not yet be shown. | ||
Past election results
| Election Results in Wisconsin State Assembly District 30 | ||||||
votes
|
Dem. %1 |
margin (Dem. - Rep.)
|
||||
|---|---|---|---|---|---|---|
| total | Dem. | Rep. | votes | points2 | ||
| 2016 President | 31,676 | 13,444 | 15,564 | 46.3% | −2,120 | −7.3 |
| 2016 Senator | 31,130 | 13,109 | 17,036 | 43.5% | −3,927 | −13.0 |
| 2018 Governor | 27,361 | 12,968 | 13,584 | 48.8% | −616 | −2.3 |
| 2018 Senator | 27,255 | 14,185 | 13,055 | 52.1% | +1,130 | +4.1 |
| 2020 President | 35,928 | 17,324 | 17,713 | 49.4% | −389 | −1.1 |
| 2022 Governor | 28,568 | 14,083 | 14,181 | 49.8% | −98 | −0.3 |
| 2022 Senator | 28,566 | 13,722 | 14,810 | 48.1% | −1,088 | −3.8 |
| 2024 President | 38,265 | 17,872 | 19,564 | 47.7% | −1,692 | −4.5 |
| 2024 Senator | 37,906 | 17,682 | 19,551 | 47.5% | −1,869 | −5.0 |
| 2024 WI Assembly | 37,464 | 17,117 | 20,309 | 45.7% | −3,192 | −8.5 |
| 2025 WI Sup. Ct.3 | 26,308 | 14,074 | 12,220 | 53.5% | +1,854 | +7.1 |
| 1 Share of the two-party vote. For Rep. share, subtract from 100. | ||||||
| 2 Dem % of the two-party vote minus Rep % of the two-party vote | ||||||
| 3 Formally nonpartisan candidates assigned party labels based on state endorsements | ||||||
| Election results allocated into 2024 district boundaries based on population overlap. Calculations by John Johnson (johndjohnson.info). | ||||||
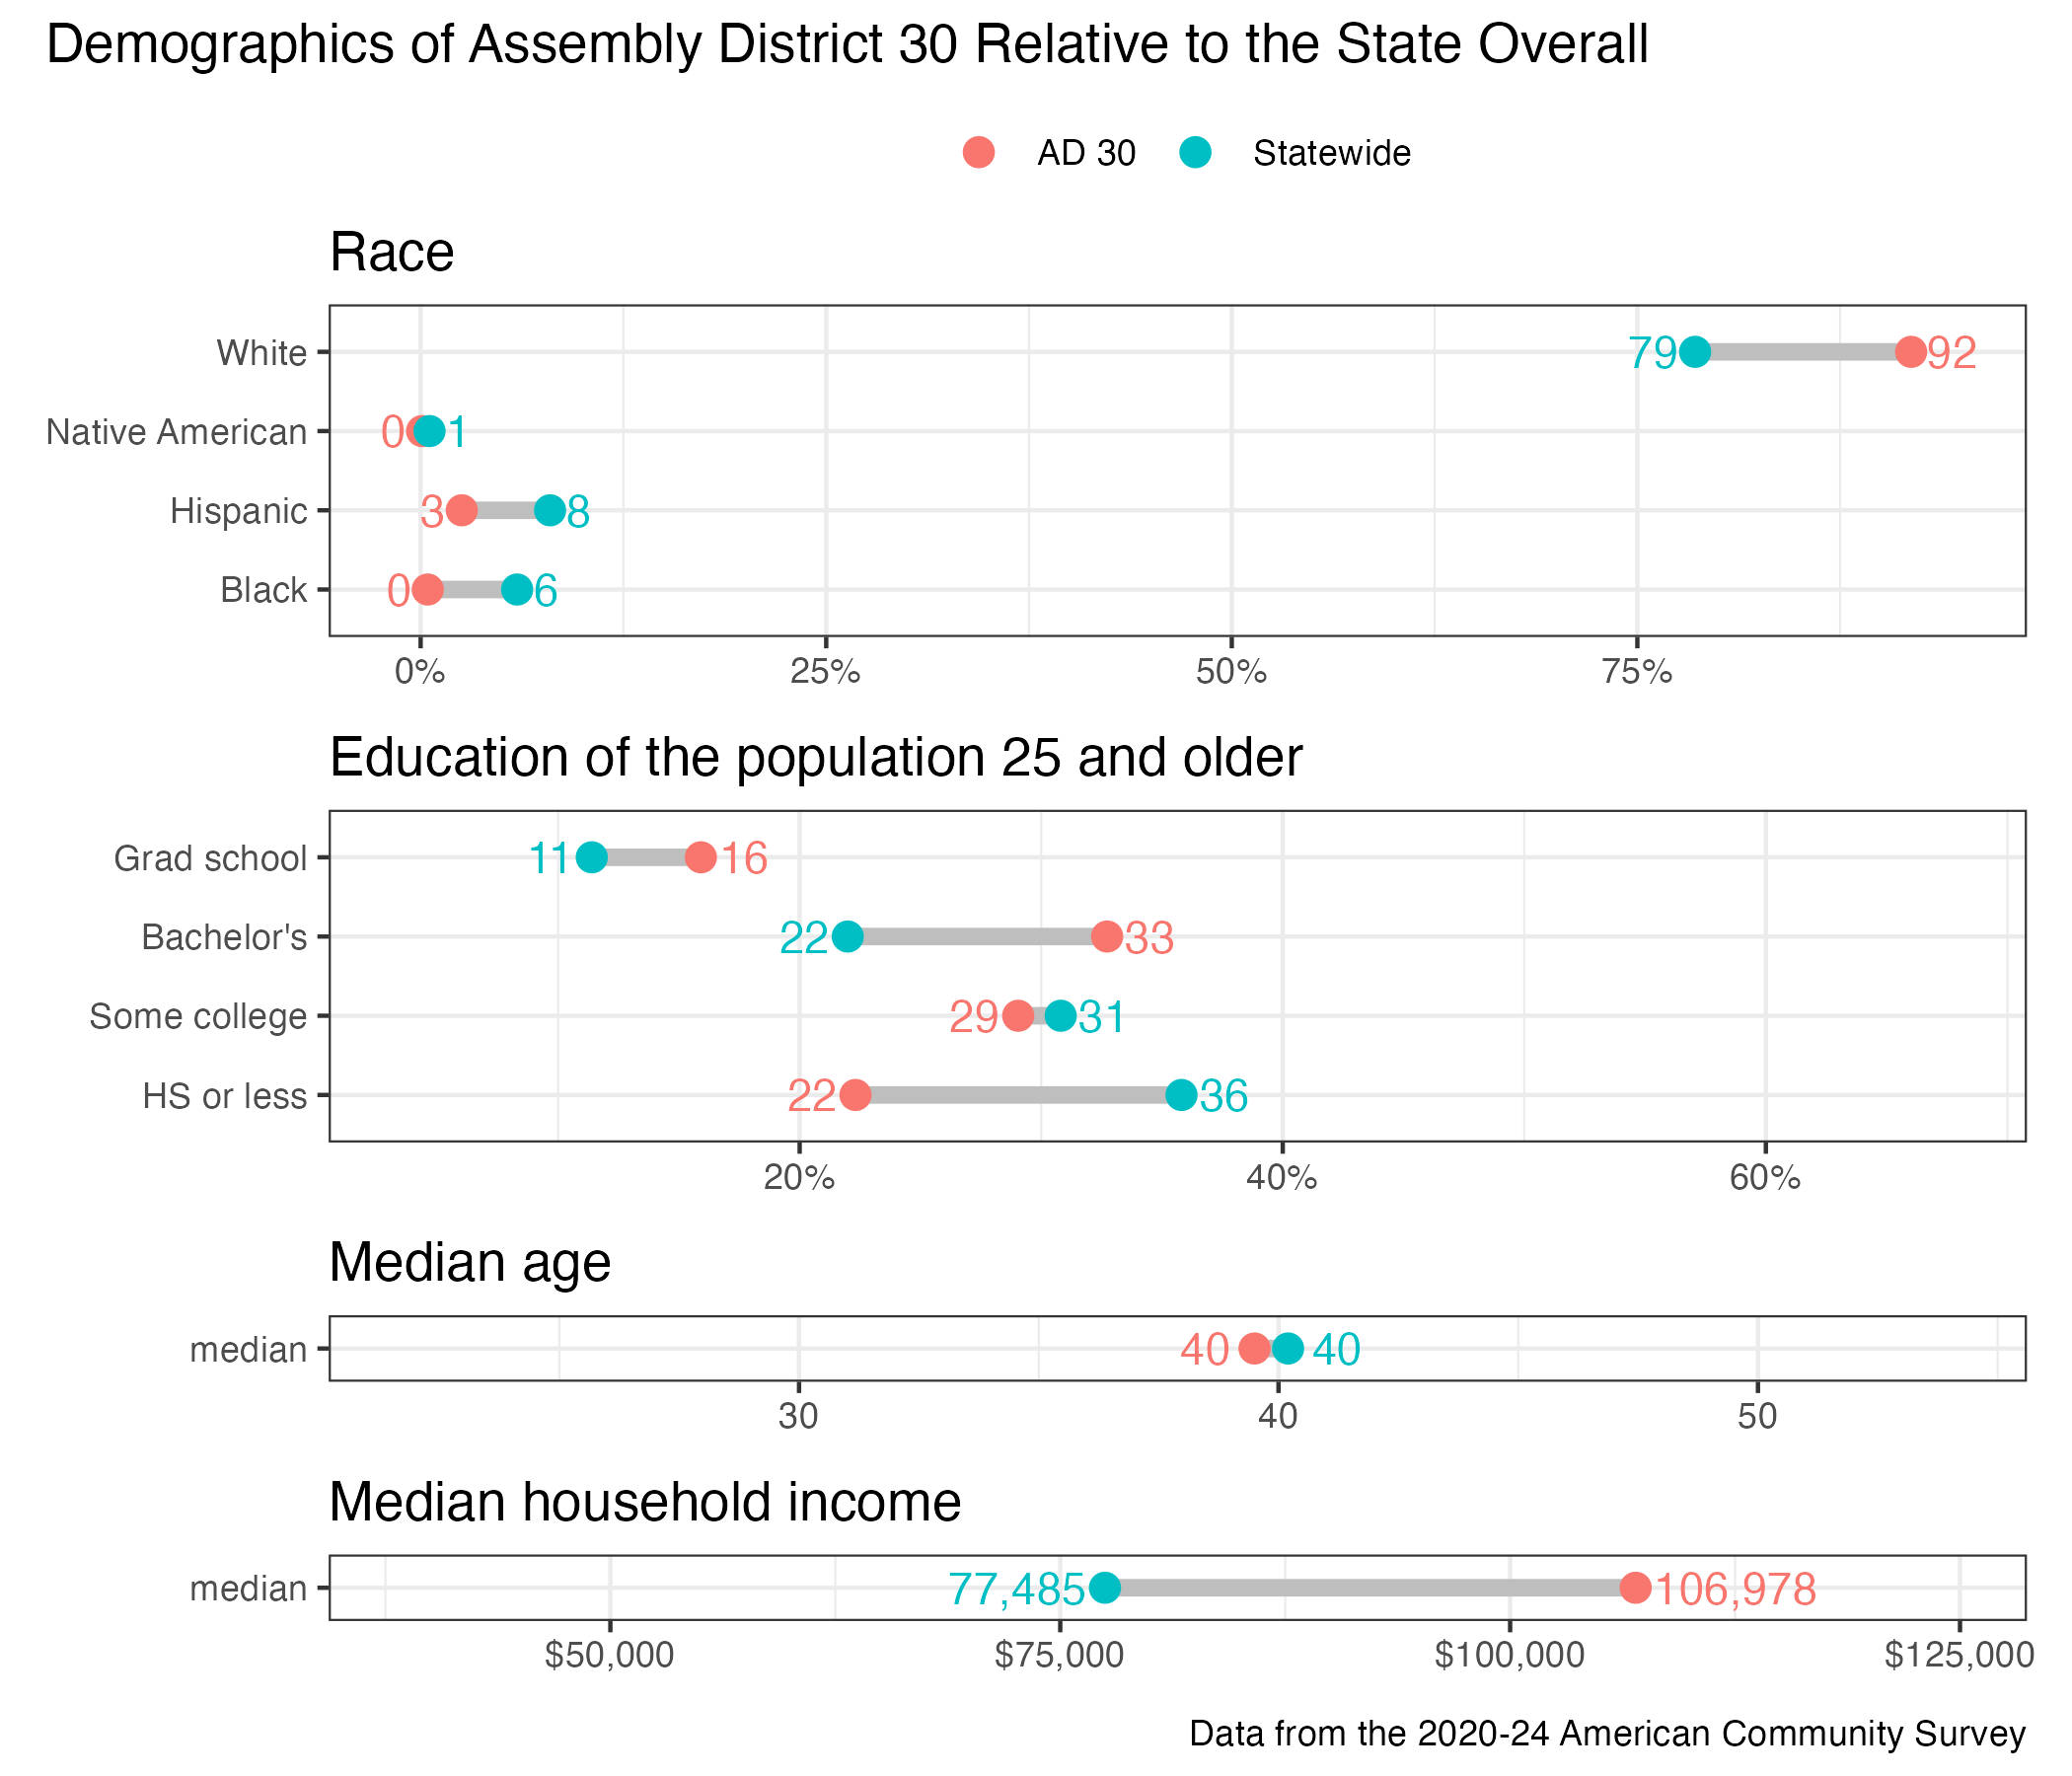
District demographics