75th Assembly District
District
Candidates
| Assembly District 75 Candidates on the Primary Ballot | ||
| Incumbent: Duke Tucker | ||
Jan 1 thru July 30
|
||
|---|---|---|
| receipts | disbursements | |
| Republican | ||
| Duke Tucker | $12,207.09 | $15,734.96 |
| Democratic | ||
| Keith Mogel | $2,444.00 | $2,305.78 |
| Data from the 2026 July Continuing Report. Any amended reports might not yet be shown. | ||
Past election results
| Election Results in Wisconsin State Assembly District 75 | ||||||
votes
|
Dem. %1 |
margin (Dem. - Rep.)
|
||||
|---|---|---|---|---|---|---|
| total | Dem. | Rep. | votes | points2 | ||
| 2016 President | 30,673 | 10,195 | 18,767 | 35.2% | −8,572 | −29.6 |
| 2016 Senator | 30,195 | 10,910 | 18,307 | 37.3% | −7,397 | −25.3 |
| 2018 Governor | 25,493 | 9,770 | 15,155 | 39.2% | −5,385 | −21.6 |
| 2018 Senator | 25,393 | 11,197 | 14,196 | 44.1% | −2,999 | −11.8 |
| 2020 President | 35,559 | 12,548 | 22,522 | 35.8% | −9,974 | −28.4 |
| 2022 Governor | 27,794 | 10,235 | 17,146 | 37.4% | −6,911 | −25.2 |
| 2022 Senator | 27,838 | 9,830 | 18,006 | 35.3% | −8,176 | −29.4 |
| 2024 President | 37,946 | 12,821 | 24,641 | 34.2% | −11,820 | −31.6 |
| 2024 Senator | 37,584 | 13,024 | 23,547 | 35.6% | −10,523 | −28.8 |
| 2024 WI Assembly | 36,940 | 12,298 | 24,642 | 33.3% | −12,344 | −33.4 |
| 2025 WI Sup. Ct.3 | 25,074 | 9,825 | 15,249 | 39.2% | −5,424 | −21.6 |
| 1 Share of the two-party vote. For Rep. share, subtract from 100. | ||||||
| 2 Dem % of the two-party vote minus Rep % of the two-party vote | ||||||
| 3 Formally nonpartisan candidates assigned party labels based on state endorsements | ||||||
| Election results allocated into 2024 district boundaries based on population overlap. Calculations by John Johnson (johndjohnson.info). | ||||||
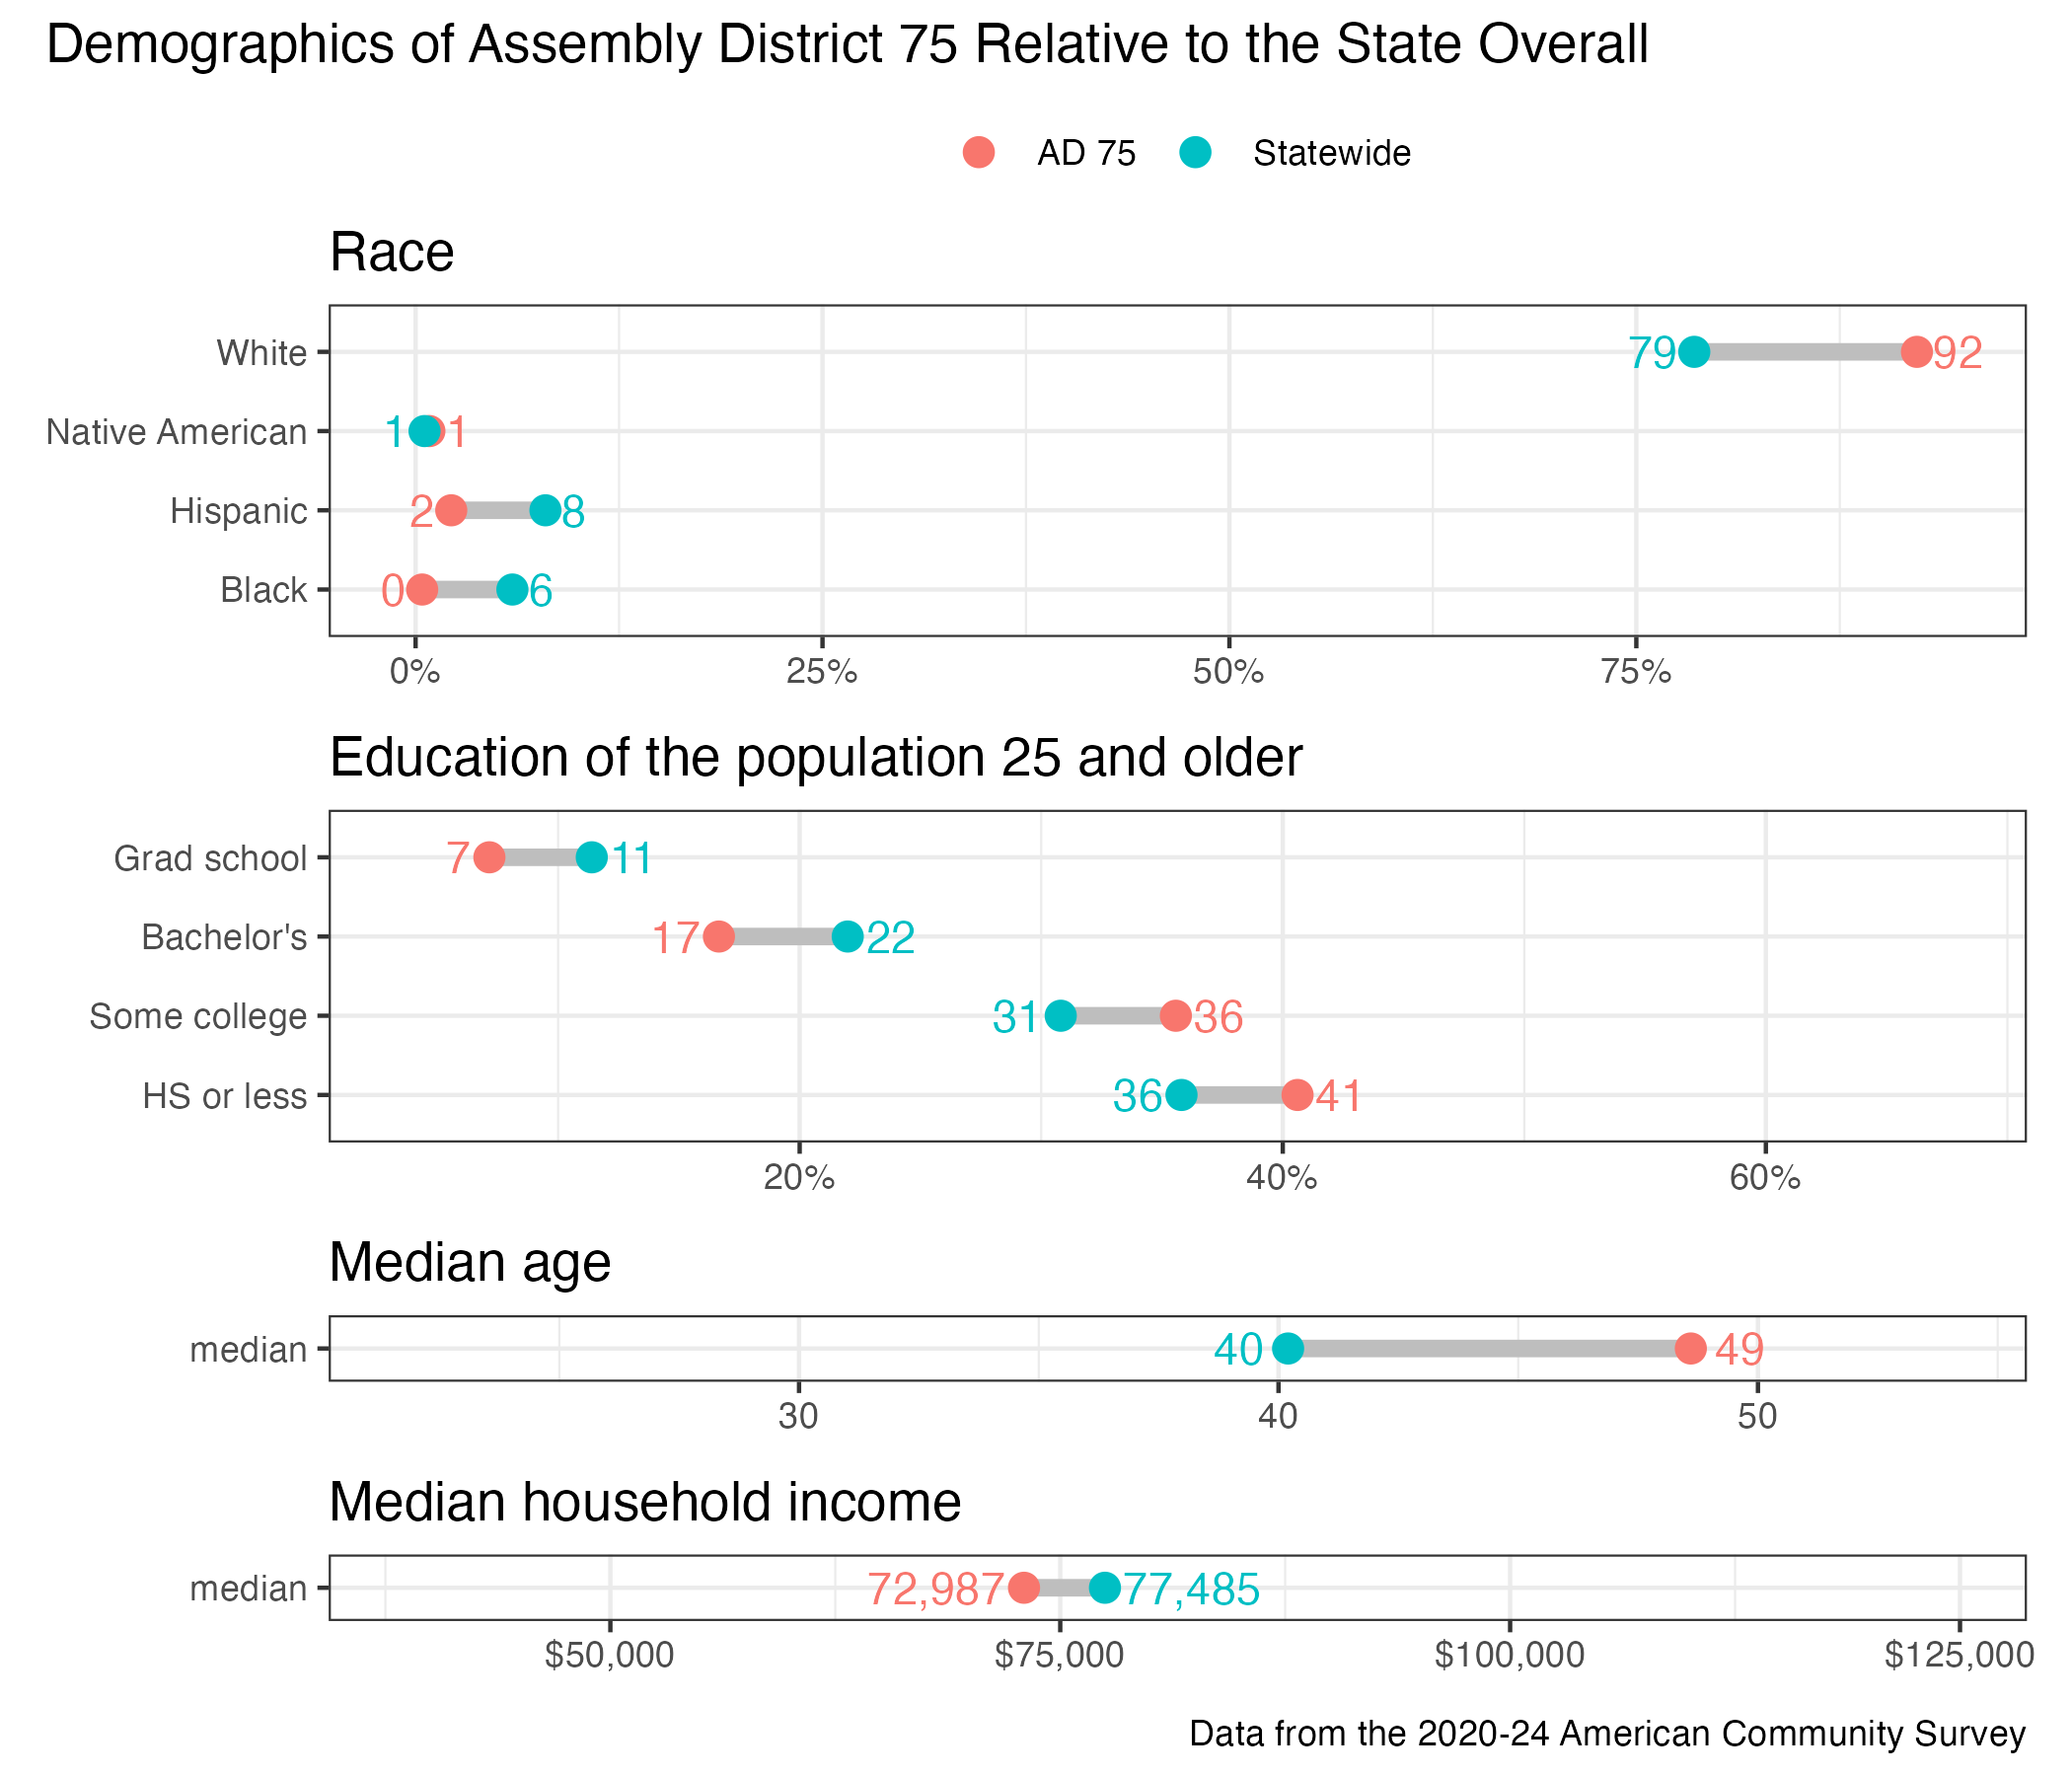
District demographics