70th Assembly District
District
Candidates
| Assembly District 70 Candidates on the Primary Ballot | ||
| Incumbent: Nancy Lynn VanderMeer | ||
Jan 1 thru July 30
|
||
|---|---|---|
| receipts | disbursements | |
| Republican | ||
| Nancy VanderMeer | $20,990.00 | $18,796.77 |
| Democratic | ||
| Stephanie Stuve Bodeen | $5,140.00 | $417.01 |
| Data from the 2026 July Continuing Report. Any amended reports might not yet be shown. | ||
Past election results
| Election Results in Wisconsin State Assembly District 70 | ||||||
votes
|
Dem. %1 |
margin (Dem. - Rep.)
|
||||
|---|---|---|---|---|---|---|
| total | Dem. | Rep. | votes | points2 | ||
| 2016 President | 25,642 | 9,472 | 14,604 | 39.3% | −5,132 | −21.3 |
| 2016 Senator | 25,316 | 10,480 | 13,646 | 43.4% | −3,166 | −13.1 |
| 2018 Governor | 21,791 | 9,482 | 11,827 | 44.5% | −2,345 | −11.0 |
| 2018 Senator | 21,702 | 10,879 | 10,807 | 50.2% | +72 | +0.3 |
| 2020 President | 28,755 | 10,899 | 17,384 | 38.5% | −6,485 | −22.9 |
| 2022 Governor | 22,201 | 9,108 | 12,744 | 41.7% | −3,636 | −16.6 |
| 2022 Senator | 22,177 | 8,469 | 13,669 | 38.3% | −5,200 | −23.5 |
| 2024 President | 29,733 | 10,828 | 18,512 | 36.9% | −7,684 | −26.2 |
| 2024 Senator | 29,507 | 11,181 | 17,410 | 39.1% | −6,229 | −21.8 |
| 2024 WI Assembly | 28,988 | 9,626 | 19,344 | 33.2% | −9,718 | −33.5 |
| 2025 WI Sup. Ct.3 | 19,495 | 8,780 | 10,708 | 45.1% | −1,928 | −9.9 |
| 1 Share of the two-party vote. For Rep. share, subtract from 100. | ||||||
| 2 Dem % of the two-party vote minus Rep % of the two-party vote | ||||||
| 3 Formally nonpartisan candidates assigned party labels based on state endorsements | ||||||
| Election results allocated into 2024 district boundaries based on population overlap. Calculations by John Johnson (johndjohnson.info). | ||||||
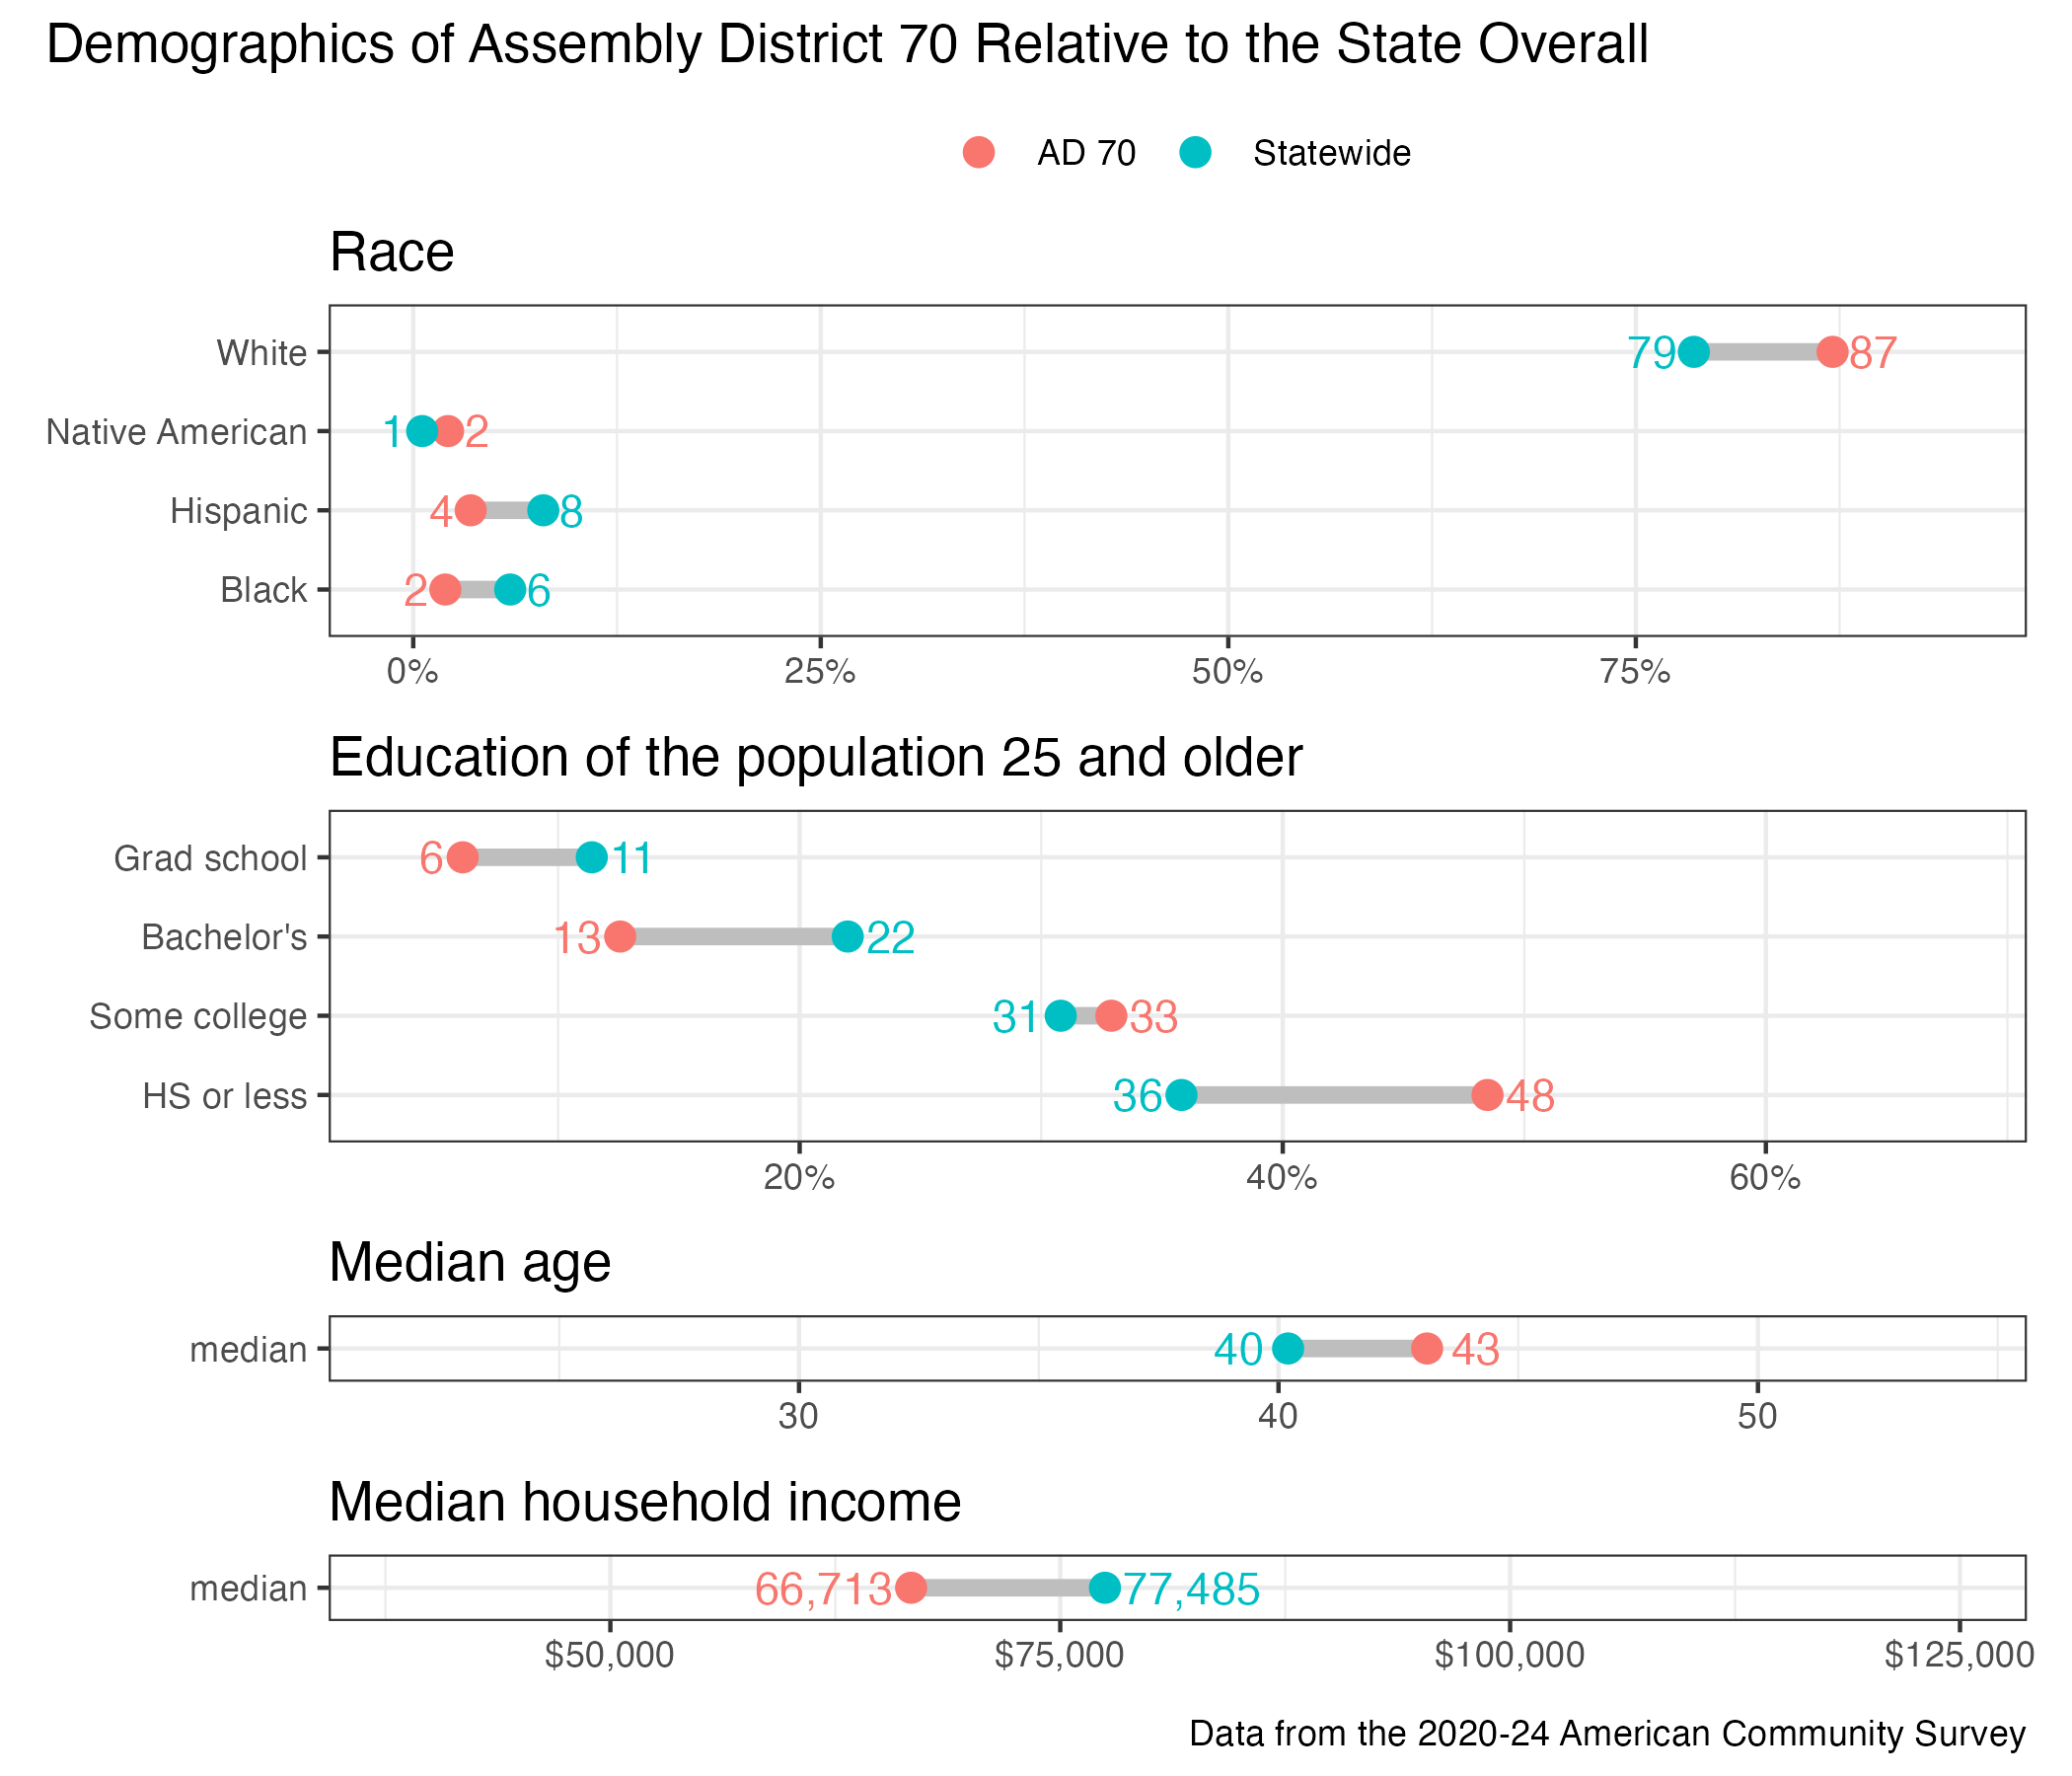
District demographics