71st Assembly District
District
Candidates
| Assembly District 71 Candidates on the Primary Ballot | ||
| Incumbent: Vinnie Miresse | ||
Jan 1 thru July 30
|
||
|---|---|---|
| receipts | disbursements | |
| Republican | ||
| Jeff Disher | $5,570.00 | $3,296.61 |
| Democratic | ||
| Vinnie Miresse | $25,475.20 | $7,840.12 |
| Data from the 2026 July Continuing Report. Any amended reports might not yet be shown. | ||
Past election results
| Election Results in Wisconsin State Assembly District 71 | ||||||
votes
|
Dem. %1 |
margin (Dem. - Rep.)
|
||||
|---|---|---|---|---|---|---|
| total | Dem. | Rep. | votes | points2 | ||
| 2016 President | 32,290 | 16,011 | 13,841 | 53.6% | +2,170 | +7.3 |
| 2016 Senator | 31,741 | 16,358 | 14,197 | 53.5% | +2,161 | +7.1 |
| 2018 Governor | 29,133 | 15,528 | 12,813 | 54.8% | +2,715 | +9.6 |
| 2018 Senator | 28,997 | 17,310 | 11,645 | 59.8% | +5,665 | +19.6 |
| 2020 President | 33,564 | 17,729 | 15,084 | 54.0% | +2,645 | +8.1 |
| 2022 Governor | 27,810 | 15,625 | 11,892 | 56.8% | +3,733 | +13.6 |
| 2022 Senator | 27,734 | 14,996 | 12,697 | 54.2% | +2,299 | +8.3 |
| 2024 President | 35,989 | 18,883 | 16,459 | 53.4% | +2,424 | +6.9 |
| 2024 Senator | 35,715 | 19,225 | 15,779 | 54.9% | +3,446 | +9.8 |
| 2024 WI Assembly | 35,065 | 18,631 | 16,416 | 53.2% | +2,215 | +6.3 |
| 2025 WI Sup. Ct.3 | 25,152 | 15,331 | 9,809 | 61.0% | +5,522 | +22.0 |
| 1 Share of the two-party vote. For Rep. share, subtract from 100. | ||||||
| 2 Dem % of the two-party vote minus Rep % of the two-party vote | ||||||
| 3 Formally nonpartisan candidates assigned party labels based on state endorsements | ||||||
| Election results allocated into 2024 district boundaries based on population overlap. Calculations by John Johnson (johndjohnson.info). | ||||||
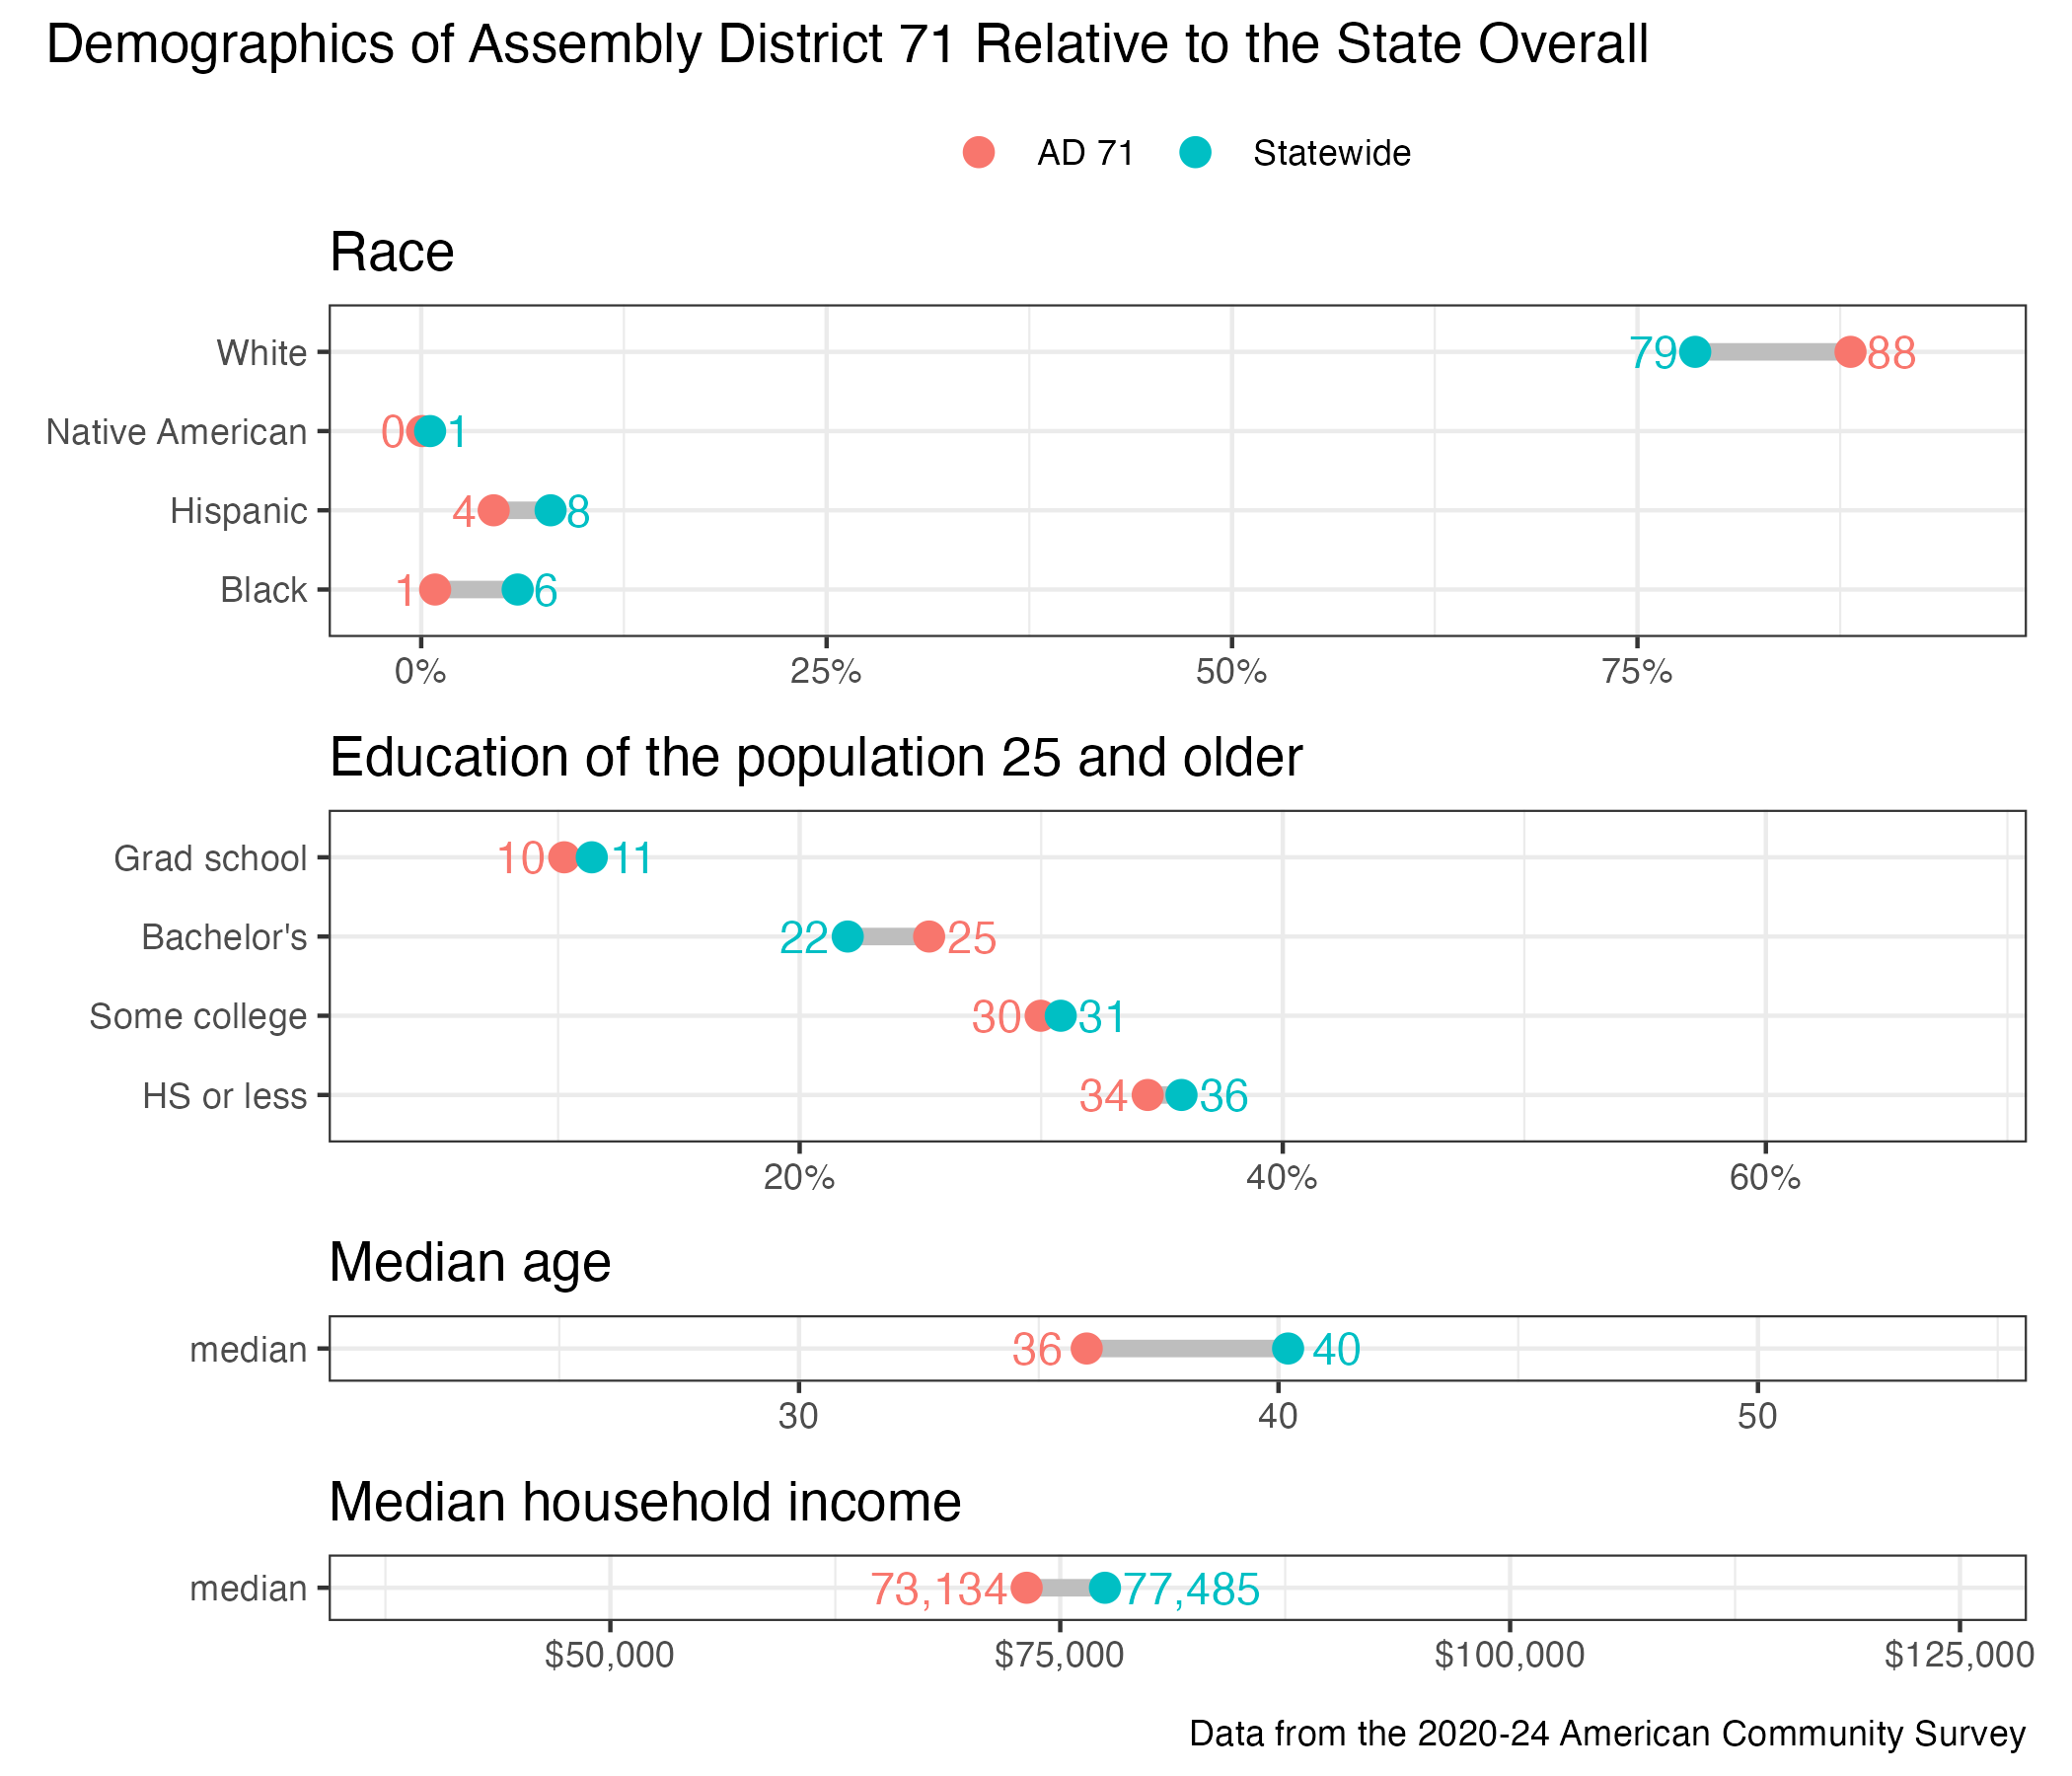
District demographics