25th Assembly District
District
Candidates
| Assembly District 25 Candidates on the Primary Ballot | ||
| Incumbent: Paul Tittl | ||
Jan 1 thru July 30
|
||
|---|---|---|
| receipts | disbursements | |
| Republican | ||
| Paul Tittl | $10,220.00 | $4,861.64 |
| Democratic | ||
| Christopher Able | $11,884.95 | $4,642.22 |
| Data from the 2026 July Continuing Report. Any amended reports might not yet be shown. | ||
Past election results
| Election Results in Wisconsin State Assembly District 25 | ||||||
votes
|
Dem. %1 |
margin (Dem. - Rep.)
|
||||
|---|---|---|---|---|---|---|
| total | Dem. | Rep. | votes | points2 | ||
| 2016 President | 28,980 | 11,179 | 15,530 | 41.9% | −4,351 | −16.3 |
| 2016 Senator | 28,255 | 10,955 | 15,990 | 40.7% | −5,035 | −18.7 |
| 2018 Governor | 25,061 | 10,349 | 14,194 | 42.2% | −3,845 | −15.7 |
| 2018 Senator | 24,959 | 12,465 | 12,466 | 50.0% | −1 | 0.0 |
| 2020 President | 31,710 | 13,102 | 17,993 | 42.1% | −4,891 | −15.7 |
| 2022 Governor | 25,206 | 10,784 | 14,033 | 43.5% | −3,249 | −13.1 |
| 2022 Senator | 25,125 | 10,266 | 14,796 | 41.0% | −4,530 | −18.1 |
| 2024 President | 32,596 | 13,541 | 18,556 | 42.2% | −5,015 | −15.6 |
| 2024 Senator | 32,301 | 13,618 | 17,916 | 43.2% | −4,298 | −13.6 |
| 2024 WI Assembly | 31,736 | 12,123 | 19,587 | 38.2% | −7,464 | −23.5 |
| 2025 WI Sup. Ct.3 | 23,077 | 10,808 | 12,255 | 46.9% | −1,447 | −6.3 |
| 1 Share of the two-party vote. For Rep. share, subtract from 100. | ||||||
| 2 Dem % of the two-party vote minus Rep % of the two-party vote | ||||||
| 3 Formally nonpartisan candidates assigned party labels based on state endorsements | ||||||
| Election results allocated into 2024 district boundaries based on population overlap. Calculations by John Johnson (johndjohnson.info). | ||||||
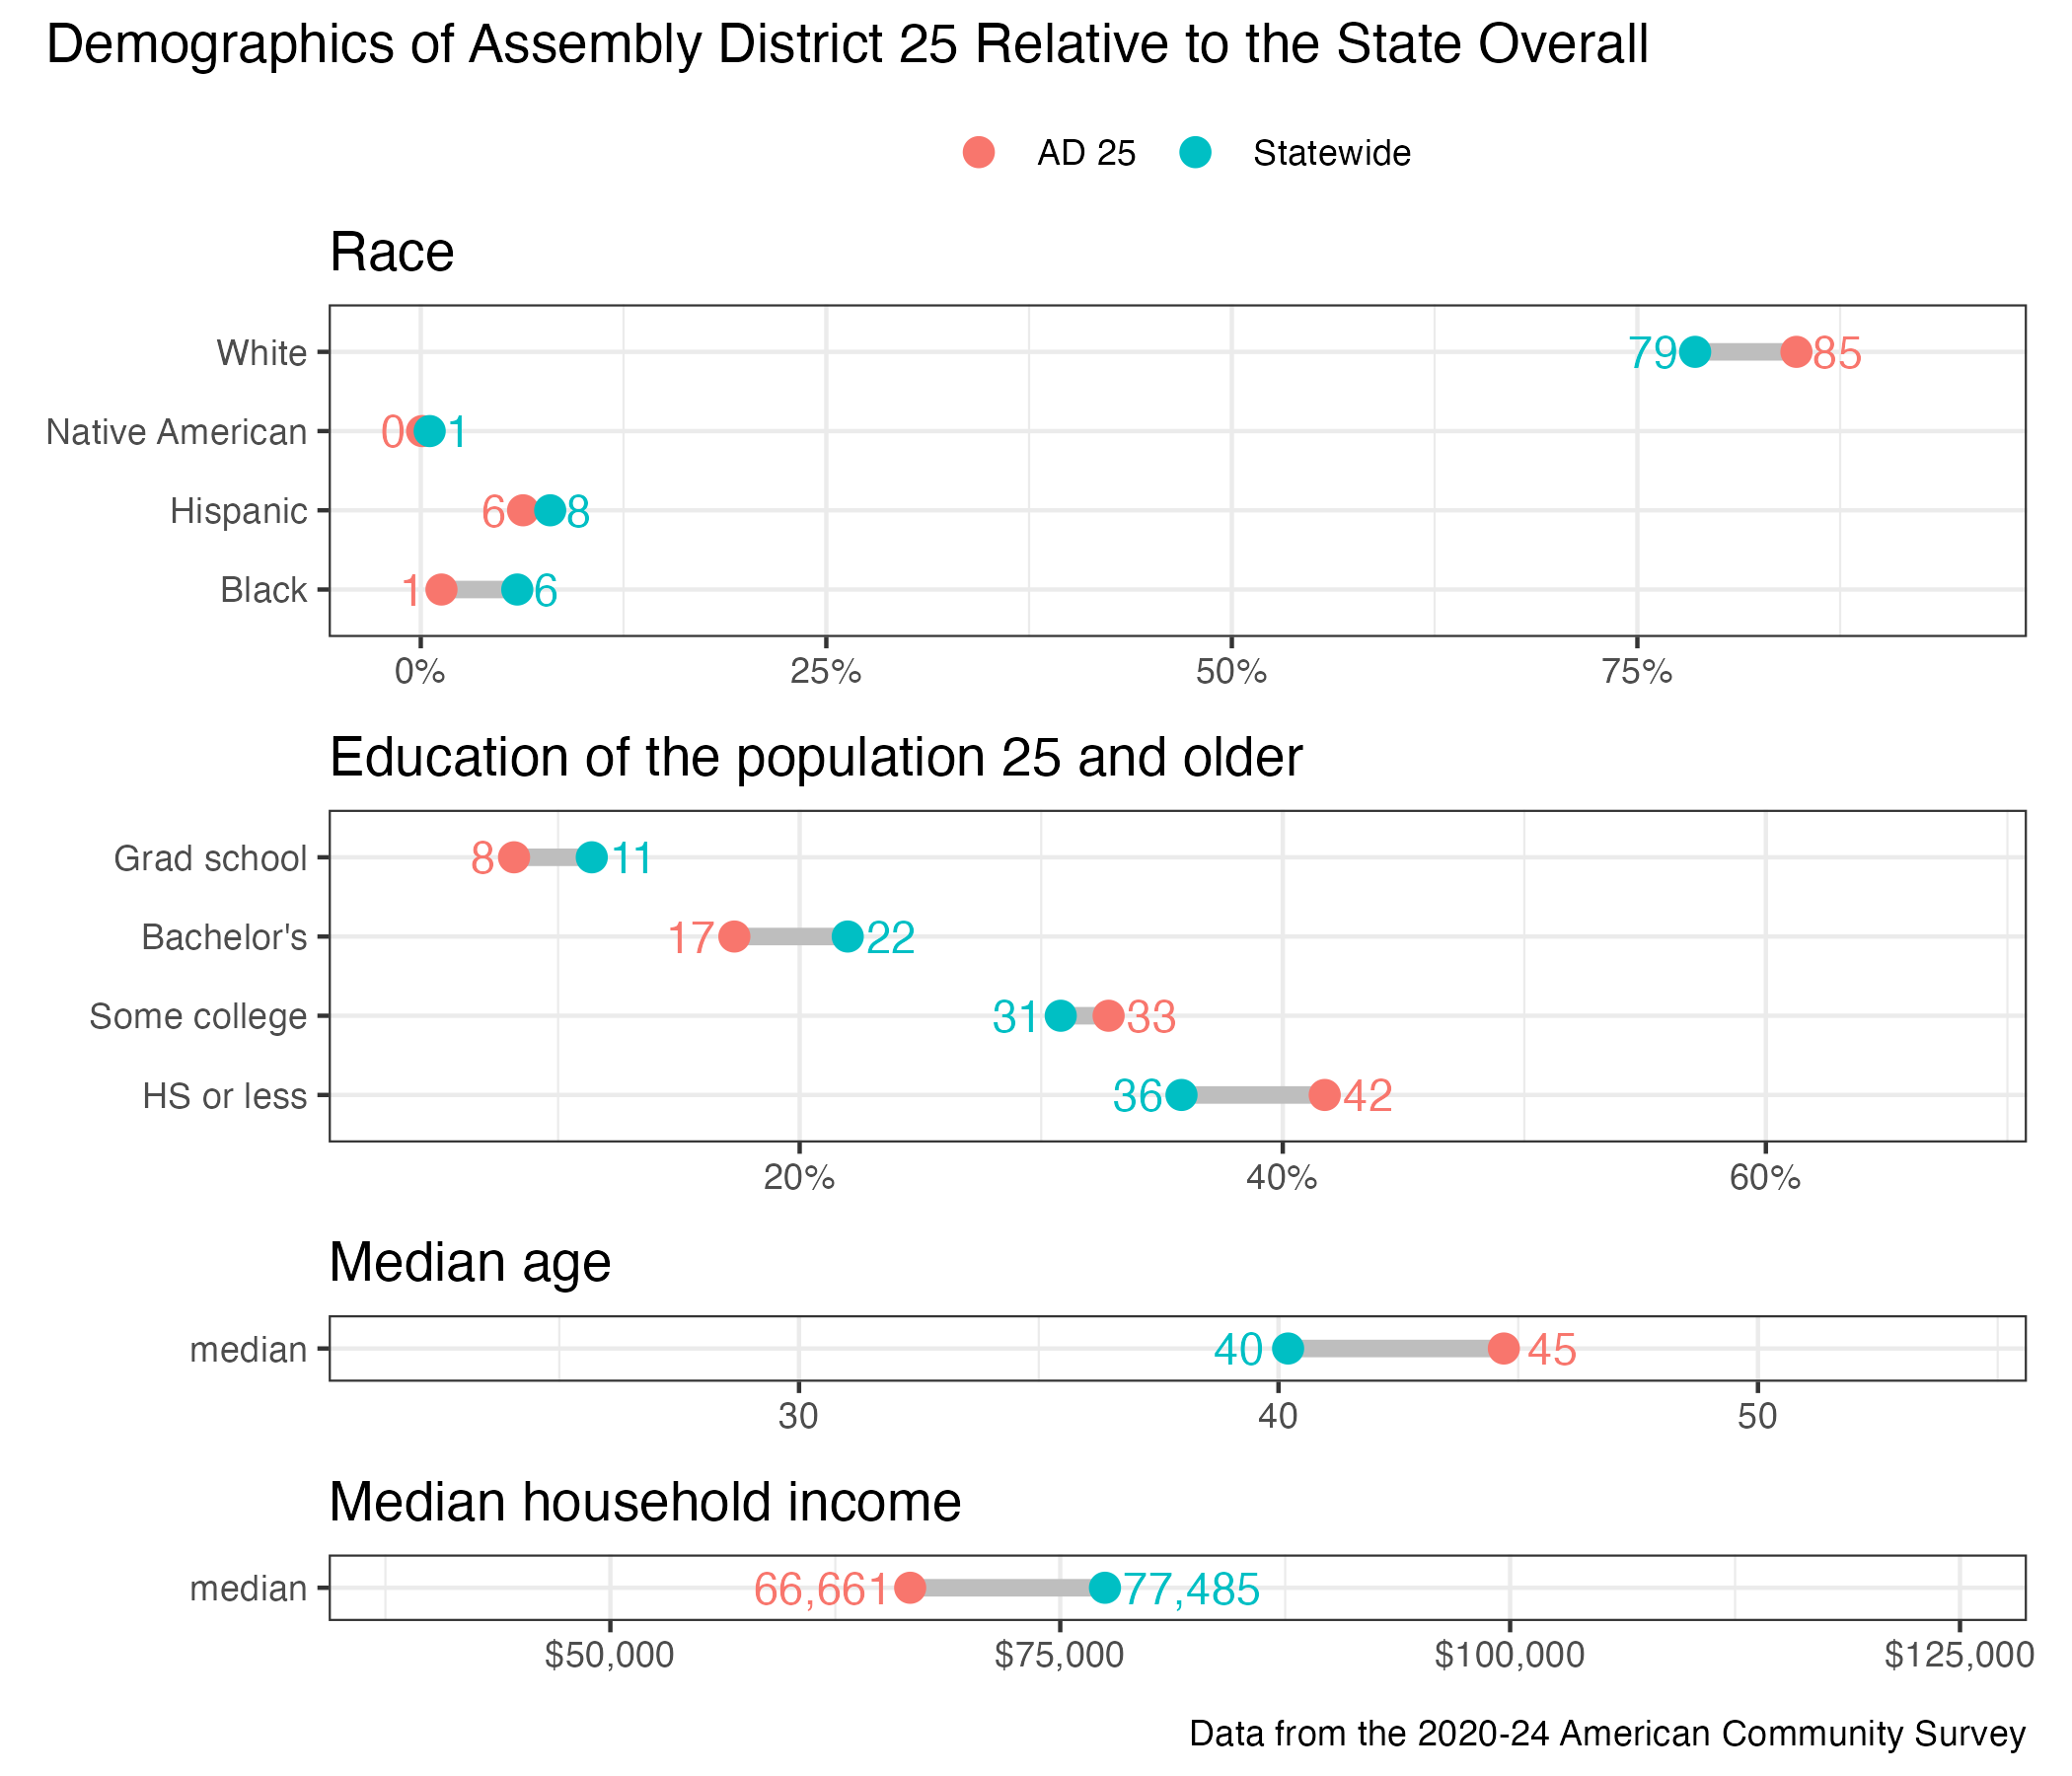
District demographics