32nd Assembly District
District
Candidates
| Assembly District 32 Candidates on the Primary Ballot | ||
| Incumbent: Amanda Nedweski | ||
Jan 1 thru July 30
|
||
|---|---|---|
| receipts | disbursements | |
| Republican | ||
| Amanda Nedweski | $28,804.29 | $21,383.33 |
| Democratic | ||
| Greg Miller | $699.00 | $89.00 |
| Data from the 2026 July Continuing Report. Any amended reports might not yet be shown. | ||
Past election results
| Election Results in Wisconsin State Assembly District 32 | ||||||
votes
|
Dem. %1 |
margin (Dem. - Rep.)
|
||||
|---|---|---|---|---|---|---|
| total | Dem. | Rep. | votes | points2 | ||
| 2016 President | 28,497 | 9,515 | 17,266 | 35.5% | −7,751 | −28.9 |
| 2016 Senator | 28,339 | 9,516 | 17,746 | 34.9% | −8,230 | −30.2 |
| 2018 Governor | 25,177 | 9,060 | 15,362 | 37.1% | −6,302 | −25.8 |
| 2018 Senator | 25,016 | 10,815 | 14,154 | 43.3% | −3,339 | −13.4 |
| 2020 President | 34,779 | 12,131 | 22,058 | 35.5% | −9,927 | −29.0 |
| 2022 Governor | 26,833 | 9,608 | 16,871 | 36.3% | −7,263 | −27.4 |
| 2022 Senator | 26,769 | 9,246 | 17,451 | 34.6% | −8,205 | −30.7 |
| 2024 President | 36,953 | 12,435 | 23,990 | 34.1% | −11,555 | −31.7 |
| 2024 Senator | 36,535 | 12,412 | 23,129 | 34.9% | −10,717 | −30.2 |
| 2024 WI Assembly | 35,709 | 11,409 | 24,257 | 32.0% | −12,848 | −36.0 |
| 2025 WI Sup. Ct.3 | 24,145 | 9,687 | 14,438 | 40.2% | −4,751 | −19.7 |
| 1 Share of the two-party vote. For Rep. share, subtract from 100. | ||||||
| 2 Dem % of the two-party vote minus Rep % of the two-party vote | ||||||
| 3 Formally nonpartisan candidates assigned party labels based on state endorsements | ||||||
| Election results allocated into 2024 district boundaries based on population overlap. Calculations by John Johnson (johndjohnson.info). | ||||||
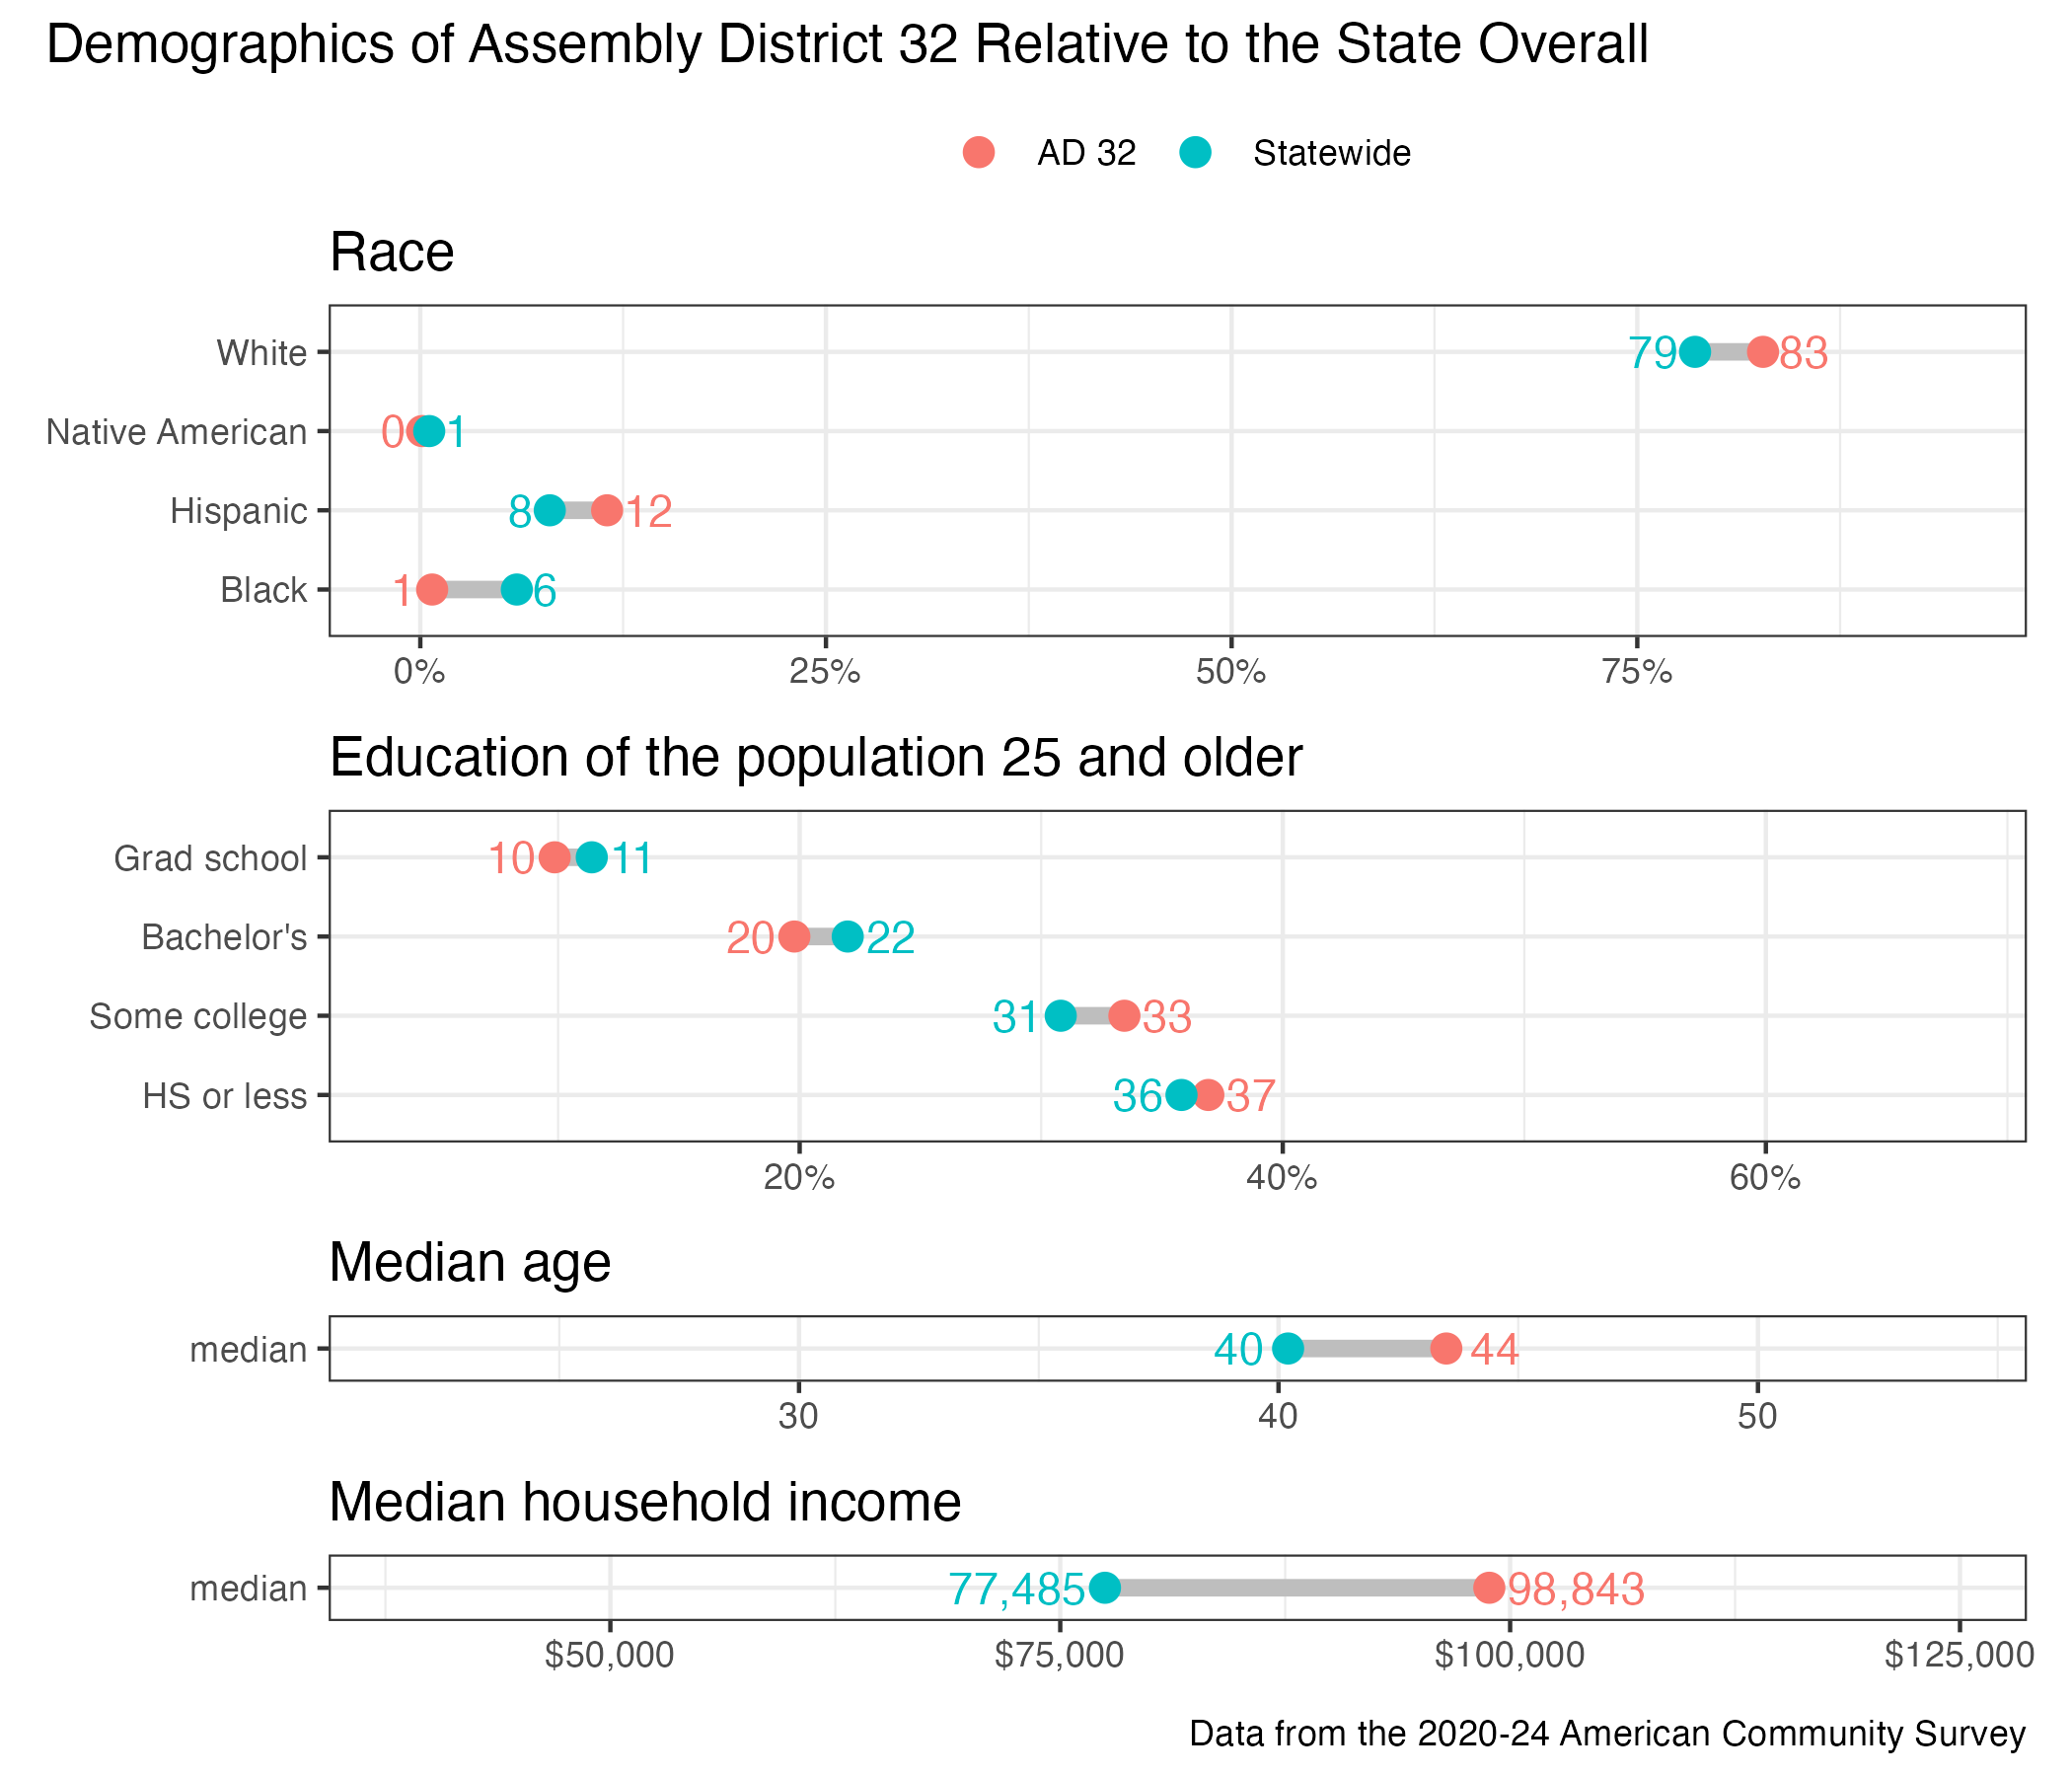
District demographics