77th Assembly District
District
Candidates
| Assembly District 77 Candidates on the Primary Ballot | ||
| Incumbent: Renuka Mayadev | ||
Jan 1 thru July 30
|
||
|---|---|---|
| receipts | disbursements | |
| Republican | ||
| Jane McCormick | $2,000.00 | $828.32 |
| Democratic | ||
| Renuka Mayadev | $29,972.00 | $7,566.93 |
| Data from the 2026 July Continuing Report. Any amended reports might not yet be shown. | ||
Past election results
| Election Results in Wisconsin State Assembly District 77 | ||||||
votes
|
Dem. %1 |
margin (Dem. - Rep.)
|
||||
|---|---|---|---|---|---|---|
| total | Dem. | Rep. | votes | points2 | ||
| 2016 President | 35,321 | 27,372 | 5,218 | 84.0% | +22,154 | +68.0 |
| 2016 Senator | 34,560 | 25,787 | 7,939 | 76.5% | +17,848 | +52.9 |
| 2018 Governor | 30,549 | 24,926 | 4,939 | 83.5% | +19,987 | +66.9 |
| 2018 Senator | 30,531 | 25,748 | 4,724 | 84.5% | +21,024 | +69.0 |
| 2020 President | 29,228 | 25,135 | 3,597 | 87.5% | +21,538 | +75.0 |
| 2022 Governor | 27,822 | 24,509 | 3,157 | 88.6% | +21,352 | +77.2 |
| 2022 Senator | 27,957 | 24,559 | 3,350 | 88.0% | +21,209 | +76.0 |
| 2024 President | 35,354 | 28,864 | 5,905 | 83.0% | +22,959 | +66.0 |
| 2024 Senator | 34,723 | 28,843 | 5,506 | 84.0% | +23,337 | +67.9 |
| 2024 WI Assembly | 30,388 | 29,888 | 0 | 100.0% | +29,888 | +100.0 |
| 2025 WI Sup. Ct.3 | 26,654 | 24,549 | 2,092 | 92.1% | +22,457 | +84.3 |
| 1 Share of the two-party vote. For Rep. share, subtract from 100. | ||||||
| 2 Dem % of the two-party vote minus Rep % of the two-party vote | ||||||
| 3 Formally nonpartisan candidates assigned party labels based on state endorsements | ||||||
| Election results allocated into 2024 district boundaries based on population overlap. Calculations by John Johnson (johndjohnson.info). | ||||||
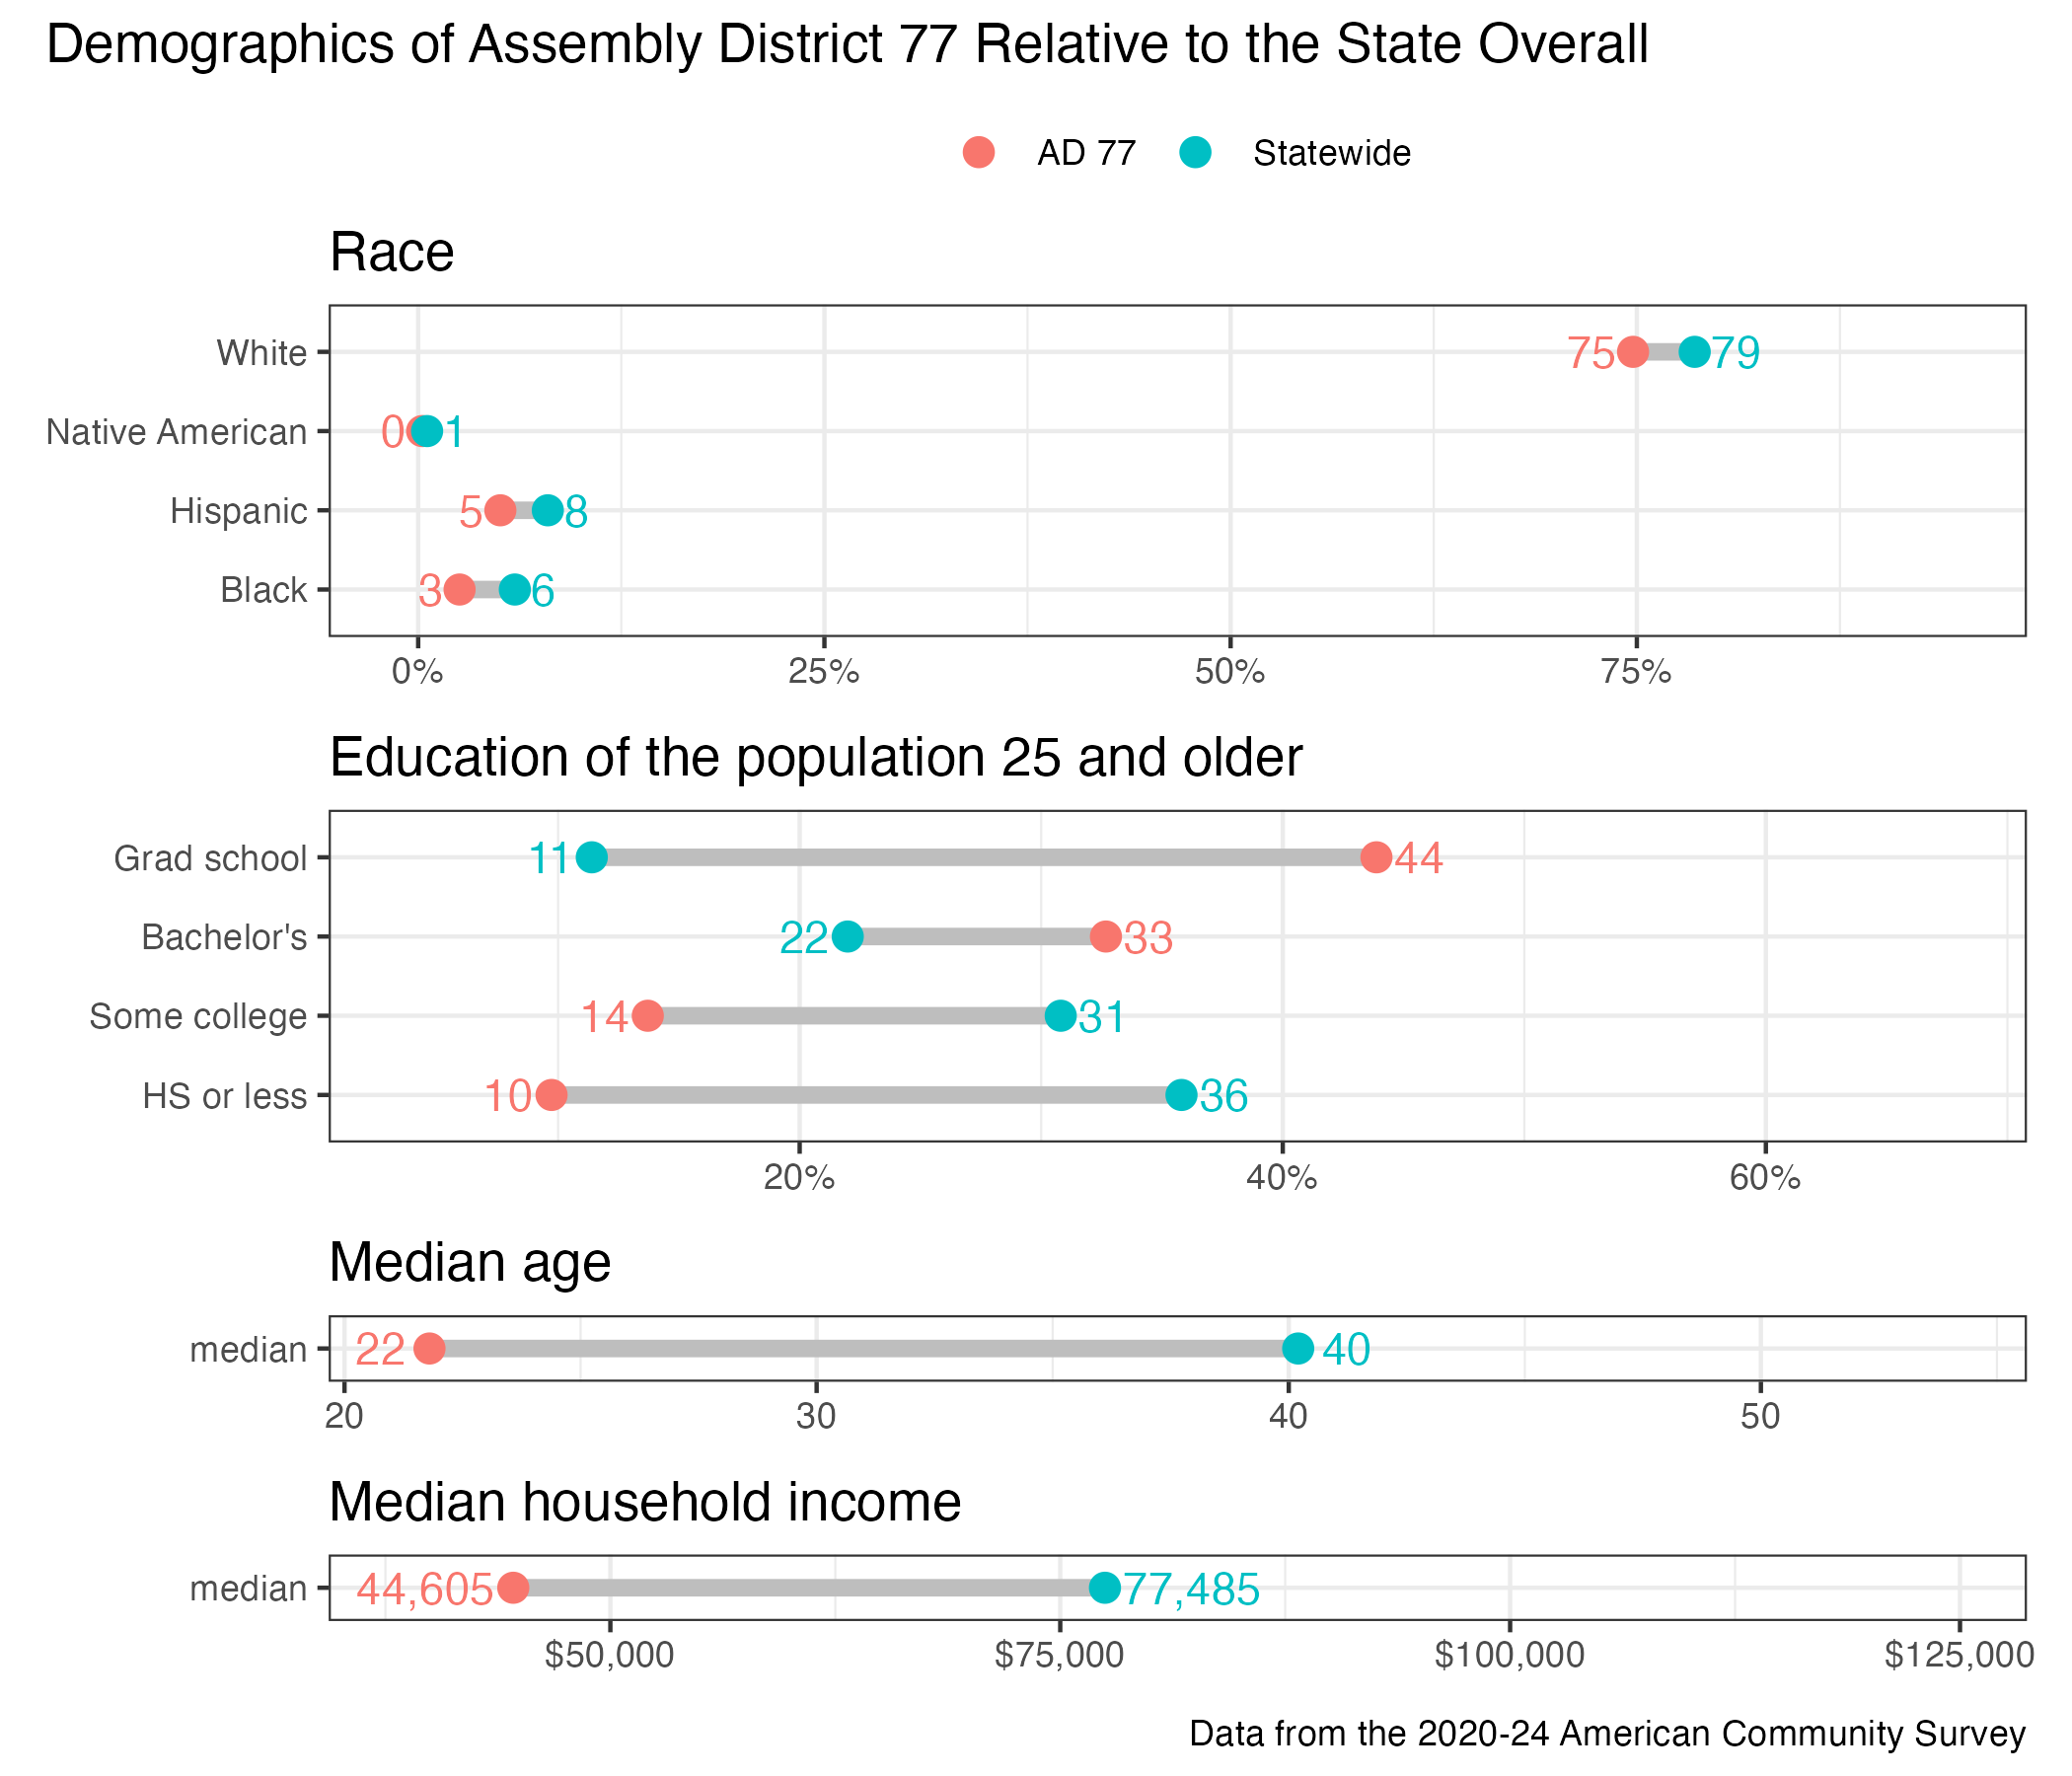
District demographics