7th Assembly District
District
Candidates
| Assembly District 7 Candidates on the Primary Ballot | ||
| Incumbent: Karen Kirsch | ||
Jan 1 thru July 30
|
||
|---|---|---|
| receipts | disbursements | |
| Republican | ||
| Lee Whiting | $700.00 | $935.31 |
| Democratic | ||
| Karen Kirsch | $7,703.93 | $6,036.17 |
| Data from the 2026 July Continuing Report. Any amended reports might not yet be shown. | ||
Past election results
| Election Results in Wisconsin State Assembly District 7 | ||||||
votes
|
Dem. %1 |
margin (Dem. - Rep.)
|
||||
|---|---|---|---|---|---|---|
| total | Dem. | Rep. | votes | points2 | ||
| 2016 President | 26,934 | 14,123 | 10,980 | 56.3% | +3,143 | +12.5 |
| 2016 Senator | 26,553 | 13,925 | 11,816 | 54.1% | +2,109 | +8.2 |
| 2018 Governor | 23,694 | 13,175 | 9,953 | 57.0% | +3,222 | +13.9 |
| 2018 Senator | 23,527 | 14,545 | 8,923 | 62.0% | +5,622 | +24.0 |
| 2020 President | 28,347 | 16,347 | 11,519 | 58.7% | +4,828 | +17.3 |
| 2022 Governor | 21,084 | 12,699 | 8,120 | 61.0% | +4,579 | +22.0 |
| 2022 Senator | 21,094 | 12,365 | 8,678 | 58.8% | +3,687 | +17.5 |
| 2024 President | 28,972 | 16,250 | 12,042 | 57.4% | +4,208 | +14.9 |
| 2024 Senator | 28,440 | 16,418 | 11,153 | 59.5% | +5,265 | +19.1 |
| 2024 WI Assembly | 27,377 | 16,014 | 11,289 | 58.7% | +4,725 | +17.3 |
| 2025 WI Sup. Ct.3 | 18,119 | 11,922 | 6,186 | 65.8% | +5,736 | +31.7 |
| 1 Share of the two-party vote. For Rep. share, subtract from 100. | ||||||
| 2 Dem % of the two-party vote minus Rep % of the two-party vote | ||||||
| 3 Formally nonpartisan candidates assigned party labels based on state endorsements | ||||||
| Election results allocated into 2024 district boundaries based on population overlap. Calculations by John Johnson (johndjohnson.info). | ||||||
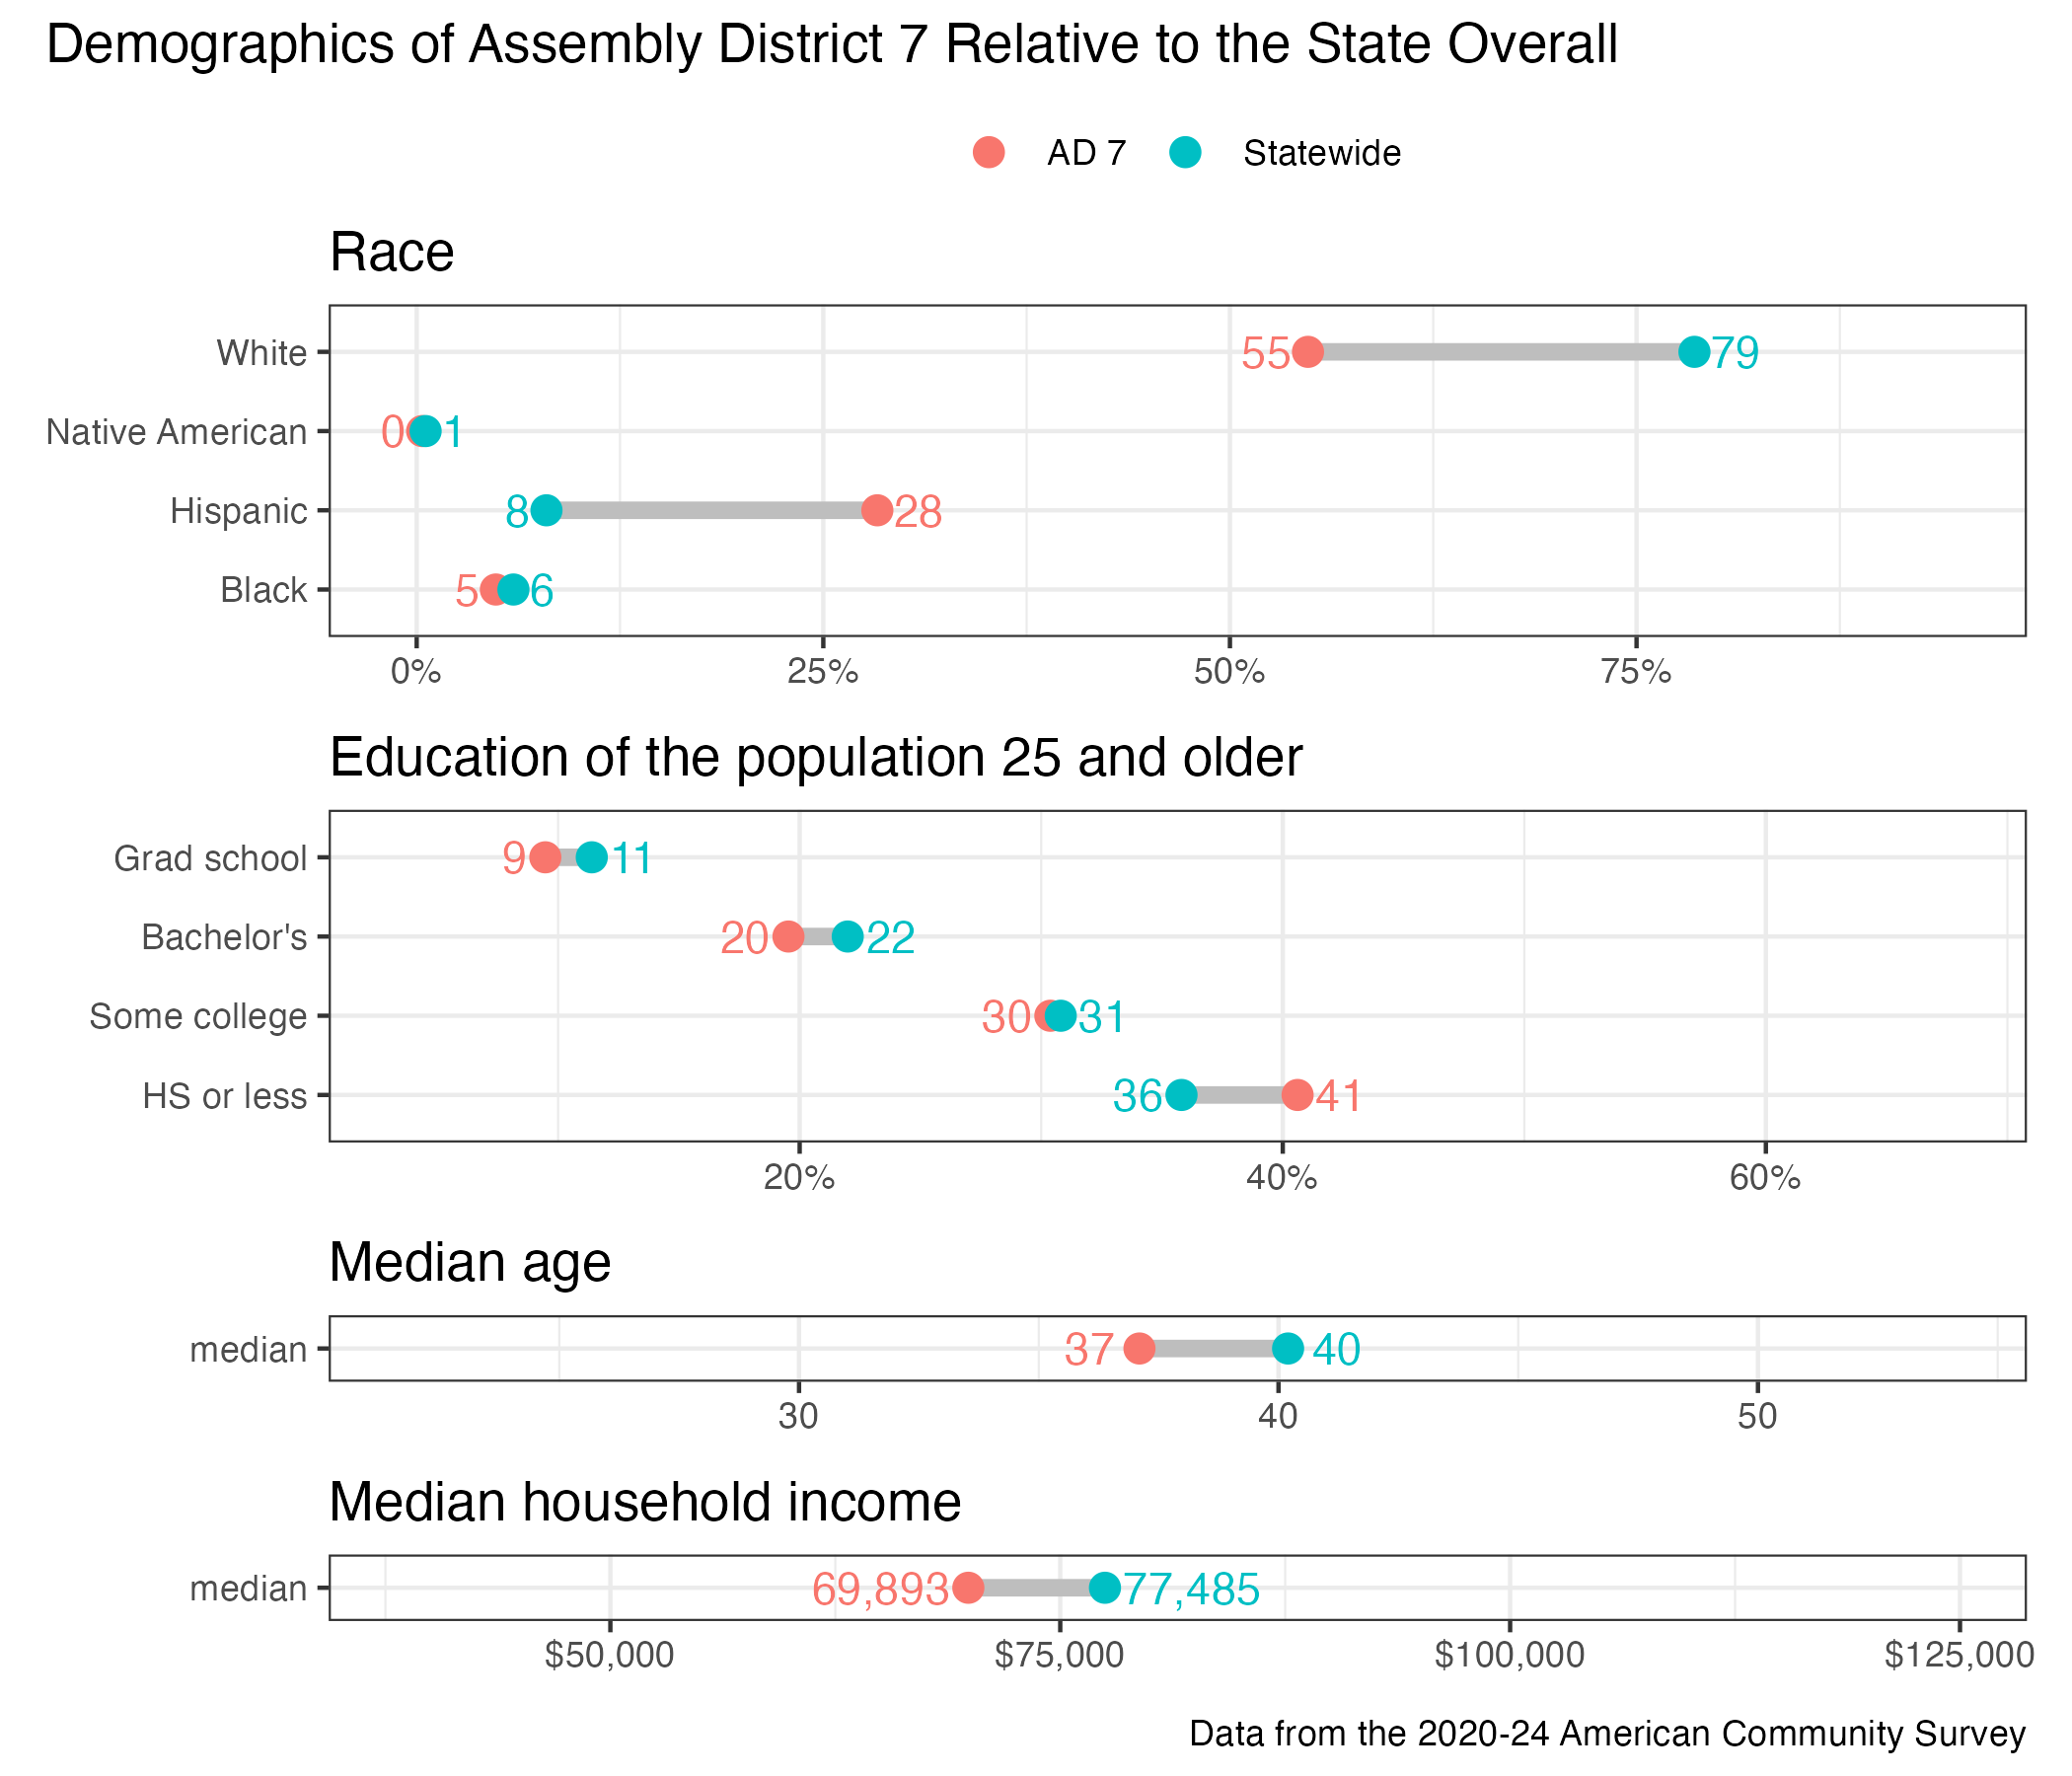
District demographics