31st Assembly District
District
Candidates
| Assembly District 31 Candidates on the Primary Ballot | ||
| Incumbent: Tyler August | ||
Jan 1 thru July 30
|
||
|---|---|---|
| receipts | disbursements | |
| Republican | ||
| Tyler August | $61,598.84 | $54,776.91 |
| Democratic | ||
| John Perryman | $9,254.41 | $3,815.38 |
| Data from the 2026 July Continuing Report. Any amended reports might not yet be shown. | ||
Past election results
| Election Results in Wisconsin State Assembly District 31 | ||||||
votes
|
Dem. %1 |
margin (Dem. - Rep.)
|
||||
|---|---|---|---|---|---|---|
| total | Dem. | Rep. | votes | points2 | ||
| 2016 President | 27,838 | 9,971 | 15,829 | 38.6% | −5,858 | −22.7 |
| 2016 Senator | 27,635 | 9,822 | 16,900 | 36.8% | −7,078 | −26.5 |
| 2018 Governor | 25,238 | 9,388 | 15,298 | 38.0% | −5,910 | −23.9 |
| 2018 Senator | 25,092 | 11,171 | 13,886 | 44.6% | −2,715 | −10.8 |
| 2020 President | 32,435 | 12,738 | 19,132 | 40.0% | −6,394 | −20.1 |
| 2022 Governor | 25,447 | 10,127 | 14,929 | 40.4% | −4,802 | −19.2 |
| 2022 Senator | 25,415 | 9,676 | 15,685 | 38.2% | −6,009 | −23.7 |
| 2024 President | 33,855 | 12,872 | 20,513 | 38.6% | −7,641 | −22.9 |
| 2024 Senator | 33,544 | 12,716 | 19,993 | 38.9% | −7,277 | −22.2 |
| 2024 WI Assembly | 32,802 | 11,965 | 20,769 | 36.6% | −8,804 | −26.9 |
| 2025 WI Sup. Ct.3 | 23,359 | 10,111 | 13,236 | 43.3% | −3,125 | −13.4 |
| 1 Share of the two-party vote. For Rep. share, subtract from 100. | ||||||
| 2 Dem % of the two-party vote minus Rep % of the two-party vote | ||||||
| 3 Formally nonpartisan candidates assigned party labels based on state endorsements | ||||||
| Election results allocated into 2024 district boundaries based on population overlap. Calculations by John Johnson (johndjohnson.info). | ||||||
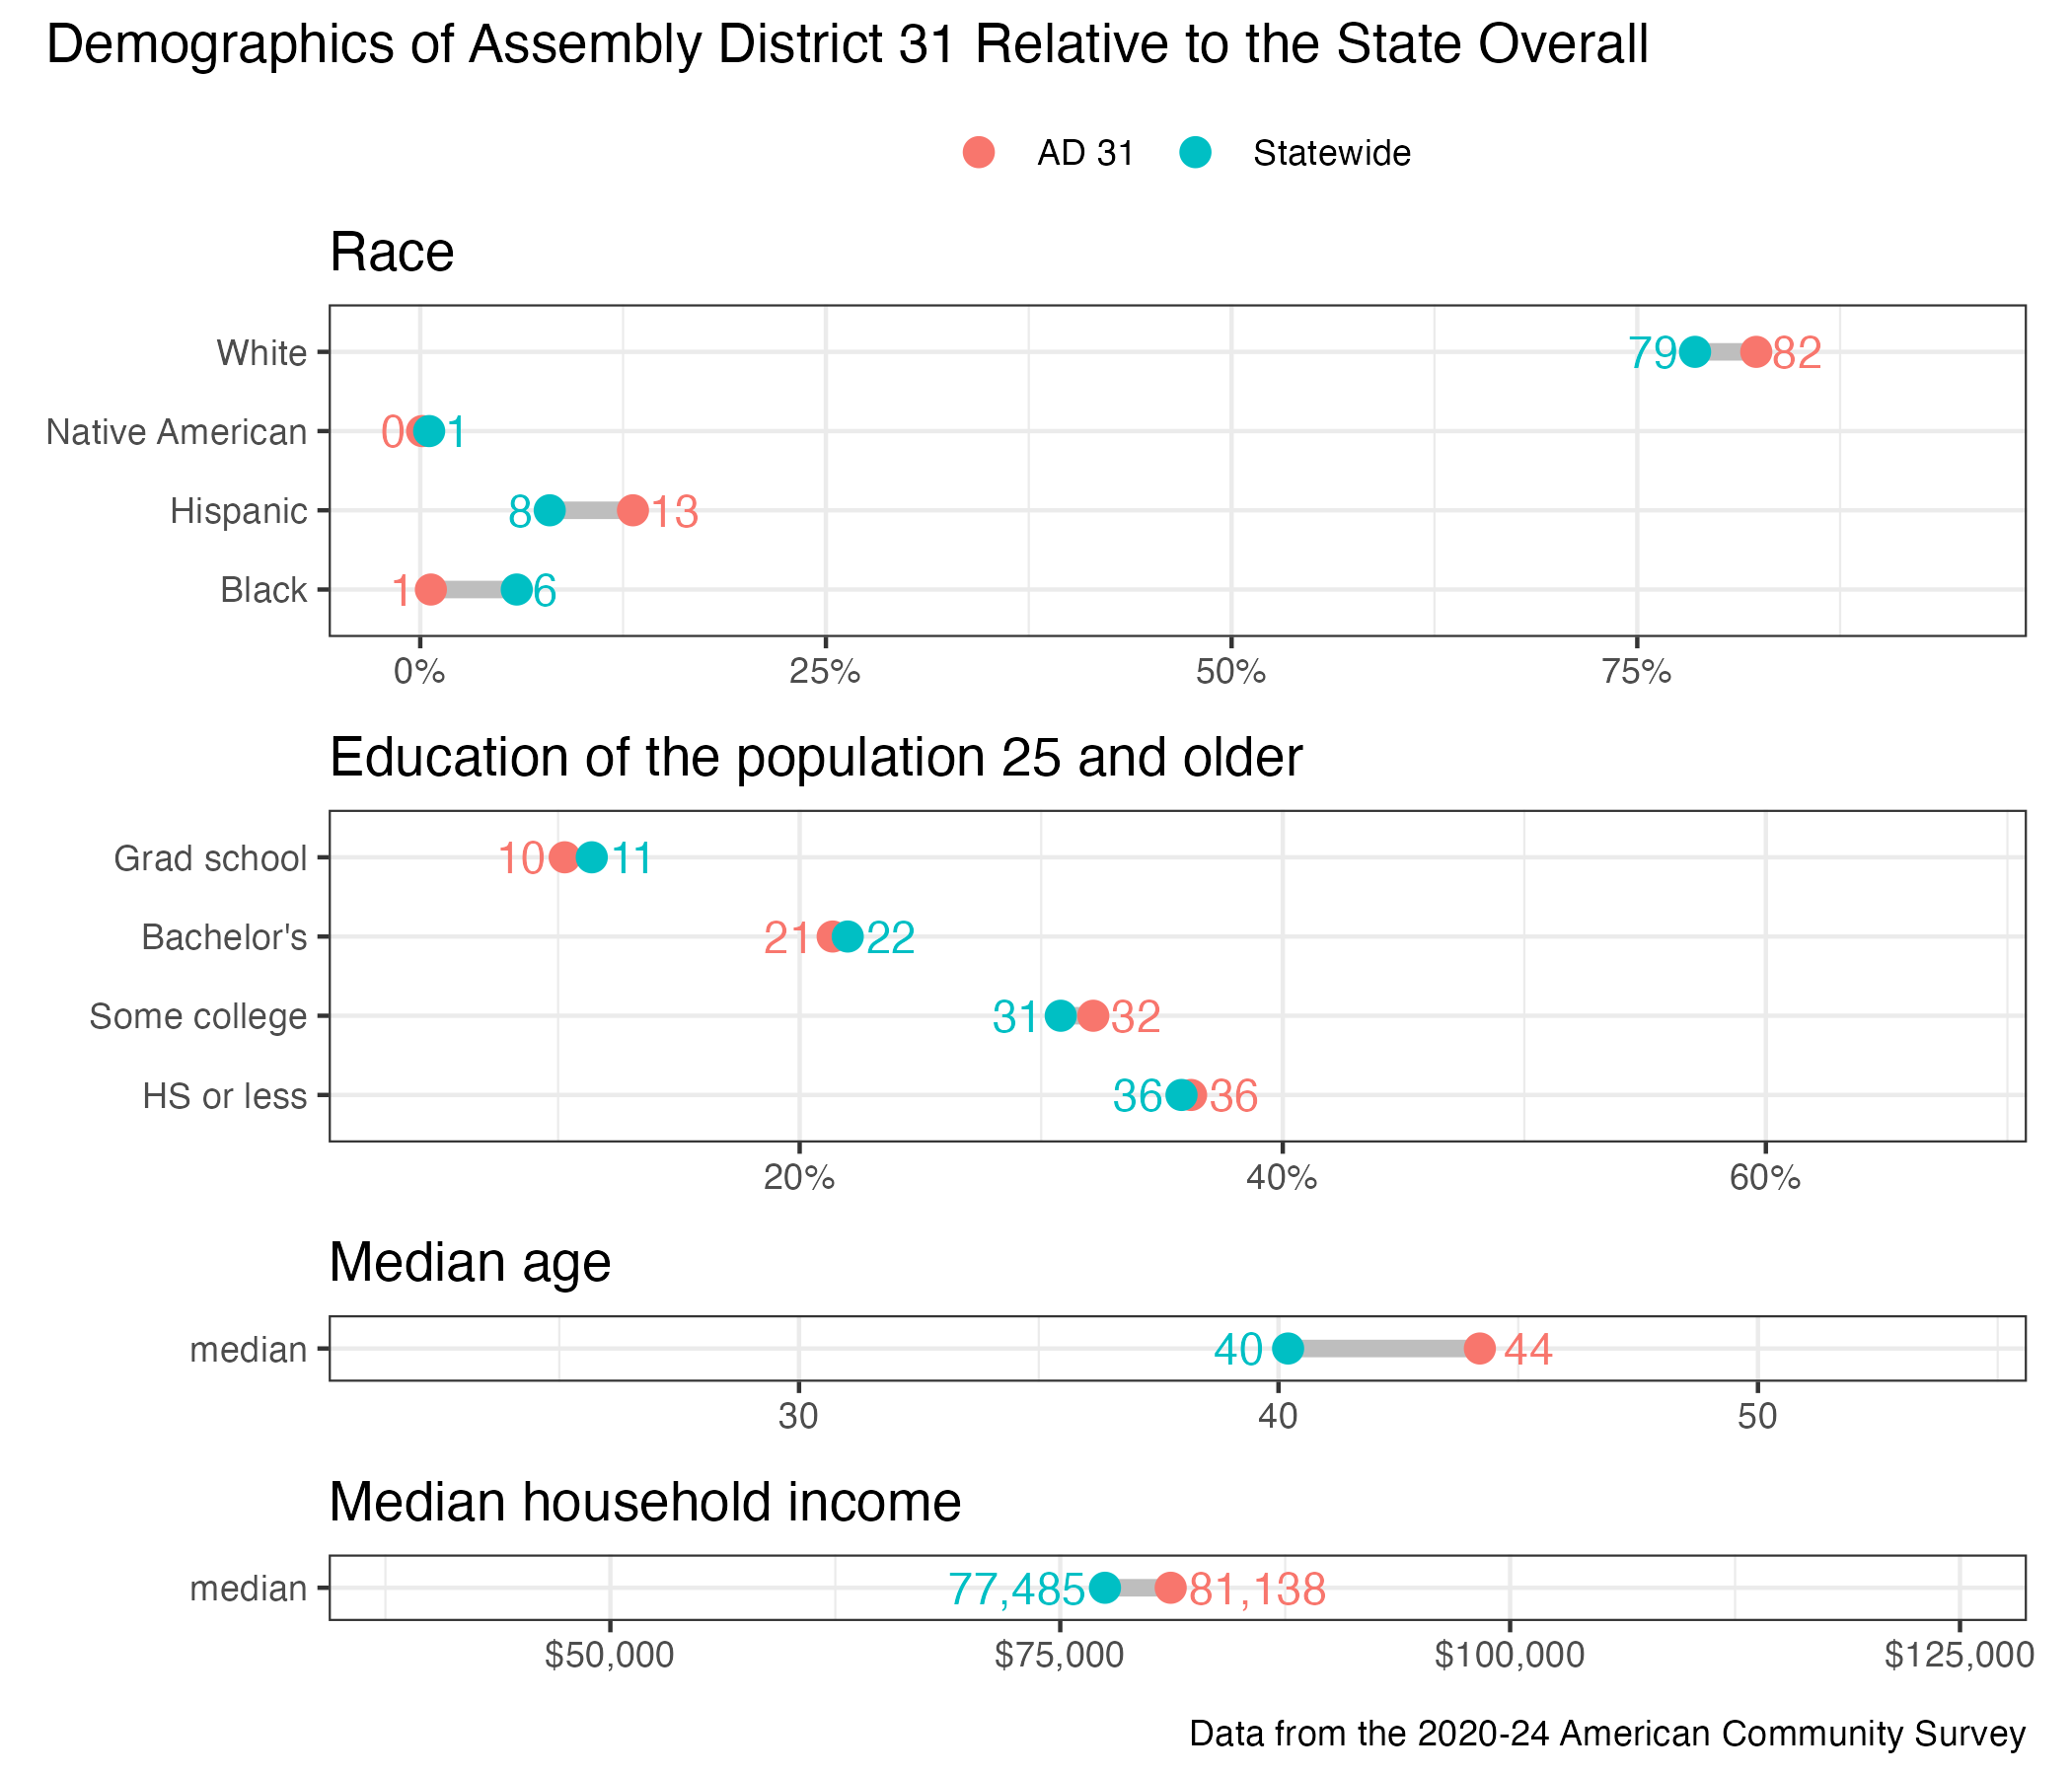
District demographics