4th Assembly District
District
Candidates
| Assembly District 4 Candidates on the Primary Ballot | ||
| Incumbent: David Steffen | ||
Jan 1 thru July 30
|
||
|---|---|---|
| receipts | disbursements | |
| Republican | ||
| David Steffen | $32,007.05 | $15,567.94 |
| Democratic | ||
| Alexia Unertl | $1,359.00 | $906.32 |
| Data from the 2026 July Continuing Report. Any amended reports might not yet be shown. | ||
Past election results
| Election Results in Wisconsin State Assembly District 4 | ||||||
votes
|
Dem. %1 |
margin (Dem. - Rep.)
|
||||
|---|---|---|---|---|---|---|
| total | Dem. | Rep. | votes | points2 | ||
| 2016 President | 31,359 | 10,234 | 19,479 | 34.4% | −9,245 | −31.1 |
| 2016 Senator | 30,917 | 10,094 | 19,784 | 33.8% | −9,690 | −32.4 |
| 2018 Governor | 27,884 | 10,252 | 17,177 | 37.4% | −6,925 | −25.2 |
| 2018 Senator | 27,750 | 11,964 | 15,759 | 43.2% | −3,795 | −13.7 |
| 2020 President | 36,226 | 12,837 | 22,870 | 36.0% | −10,033 | −28.1 |
| 2022 Governor | 29,888 | 11,019 | 18,499 | 37.3% | −7,480 | −25.3 |
| 2022 Senator | 29,847 | 10,396 | 19,388 | 34.9% | −8,992 | −30.2 |
| 2024 President | 38,406 | 13,385 | 24,534 | 35.3% | −11,149 | −29.4 |
| 2024 Senator | 38,078 | 13,495 | 23,802 | 36.2% | −10,307 | −27.6 |
| 2024 WI Assembly | 37,234 | 12,579 | 24,629 | 33.8% | −12,050 | −32.4 |
| 2025 WI Sup. Ct.3 | 25,885 | 10,385 | 15,485 | 40.1% | −5,100 | −19.7 |
| 1 Share of the two-party vote. For Rep. share, subtract from 100. | ||||||
| 2 Dem % of the two-party vote minus Rep % of the two-party vote | ||||||
| 3 Formally nonpartisan candidates assigned party labels based on state endorsements | ||||||
| Election results allocated into 2024 district boundaries based on population overlap. Calculations by John Johnson (johndjohnson.info). | ||||||
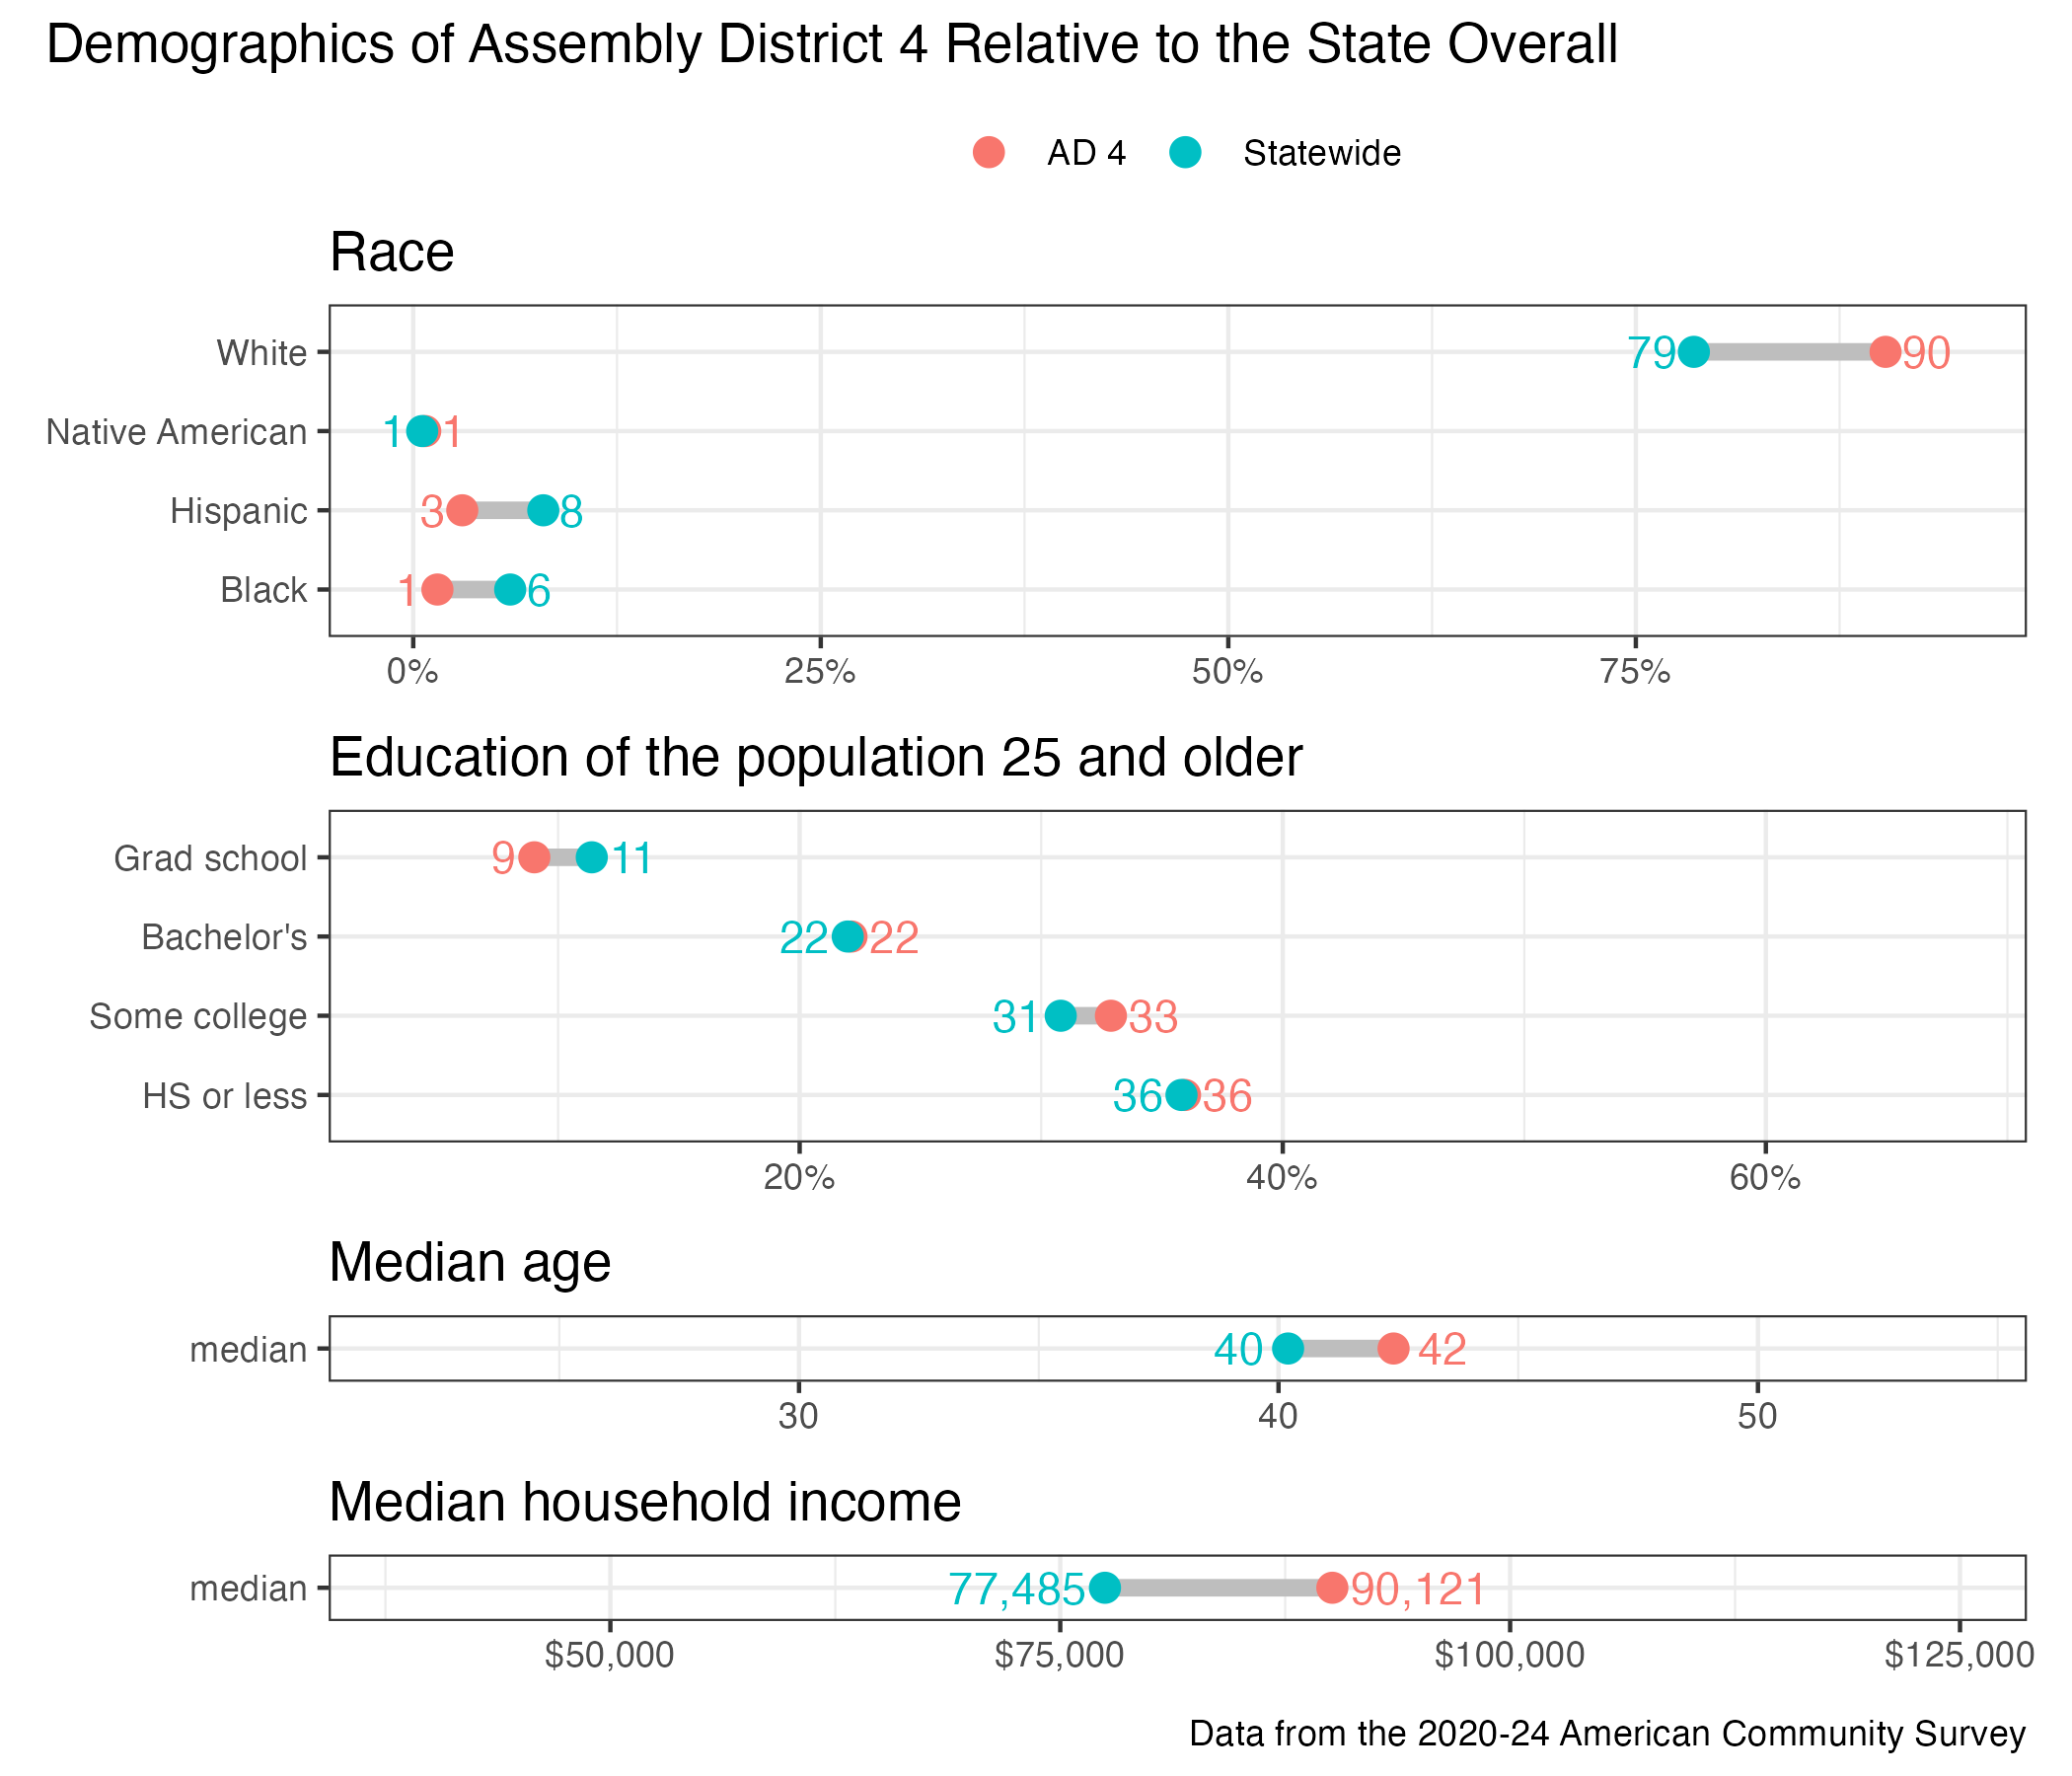
District demographics