19th Assembly District
District
Candidates
| Assembly District 19 Candidates on the Primary Ballot | ||
| Incumbent: Ryan Clancy | ||
Jan 1 thru July 30
|
||
|---|---|---|
| receipts | disbursements | |
| Republican | ||
| Yasmine B. Outlaw | $2,975.00 | $1,344.44 |
| Democratic | ||
| Ryan Clancy | $30,426.13 | $13,218.05 |
| Bridget Maniaci | $33,144.89 | $26,942.17 |
| Data from the 2026 July Continuing Report. Any amended reports might not yet be shown. | ||
Past election results
| Election Results in Wisconsin State Assembly District 19 | ||||||
votes
|
Dem. %1 |
margin (Dem. - Rep.)
|
||||
|---|---|---|---|---|---|---|
| total | Dem. | Rep. | votes | points2 | ||
| 2016 President | 32,970 | 23,566 | 6,550 | 78.3% | +17,016 | +56.5 |
| 2016 Senator | 32,493 | 22,662 | 8,874 | 71.9% | +13,788 | +43.7 |
| 2018 Governor | 31,064 | 23,545 | 6,685 | 77.9% | +16,860 | +55.8 |
| 2018 Senator | 31,058 | 24,843 | 6,146 | 80.2% | +18,697 | +60.3 |
| 2020 President | 34,592 | 27,458 | 6,354 | 81.2% | +21,104 | +62.4 |
| 2022 Governor | 28,760 | 24,084 | 4,451 | 84.4% | +19,633 | +68.8 |
| 2022 Senator | 28,884 | 24,013 | 4,823 | 83.3% | +19,190 | +66.5 |
| 2024 President | 36,680 | 28,859 | 6,932 | 80.6% | +21,927 | +61.3 |
| 2024 Senator | 36,212 | 28,934 | 6,627 | 81.4% | +22,307 | +62.7 |
| 2024 WI Assembly | 30,848 | 30,112 | 0 | 100.0% | +30,112 | +100.0 |
| 2025 WI Sup. Ct.3 | 27,786 | 24,378 | 3,393 | 87.8% | +20,985 | +75.6 |
| 1 Share of the two-party vote. For Rep. share, subtract from 100. | ||||||
| 2 Dem % of the two-party vote minus Rep % of the two-party vote | ||||||
| 3 Formally nonpartisan candidates assigned party labels based on state endorsements | ||||||
| Election results allocated into 2024 district boundaries based on population overlap. Calculations by John Johnson (johndjohnson.info). | ||||||
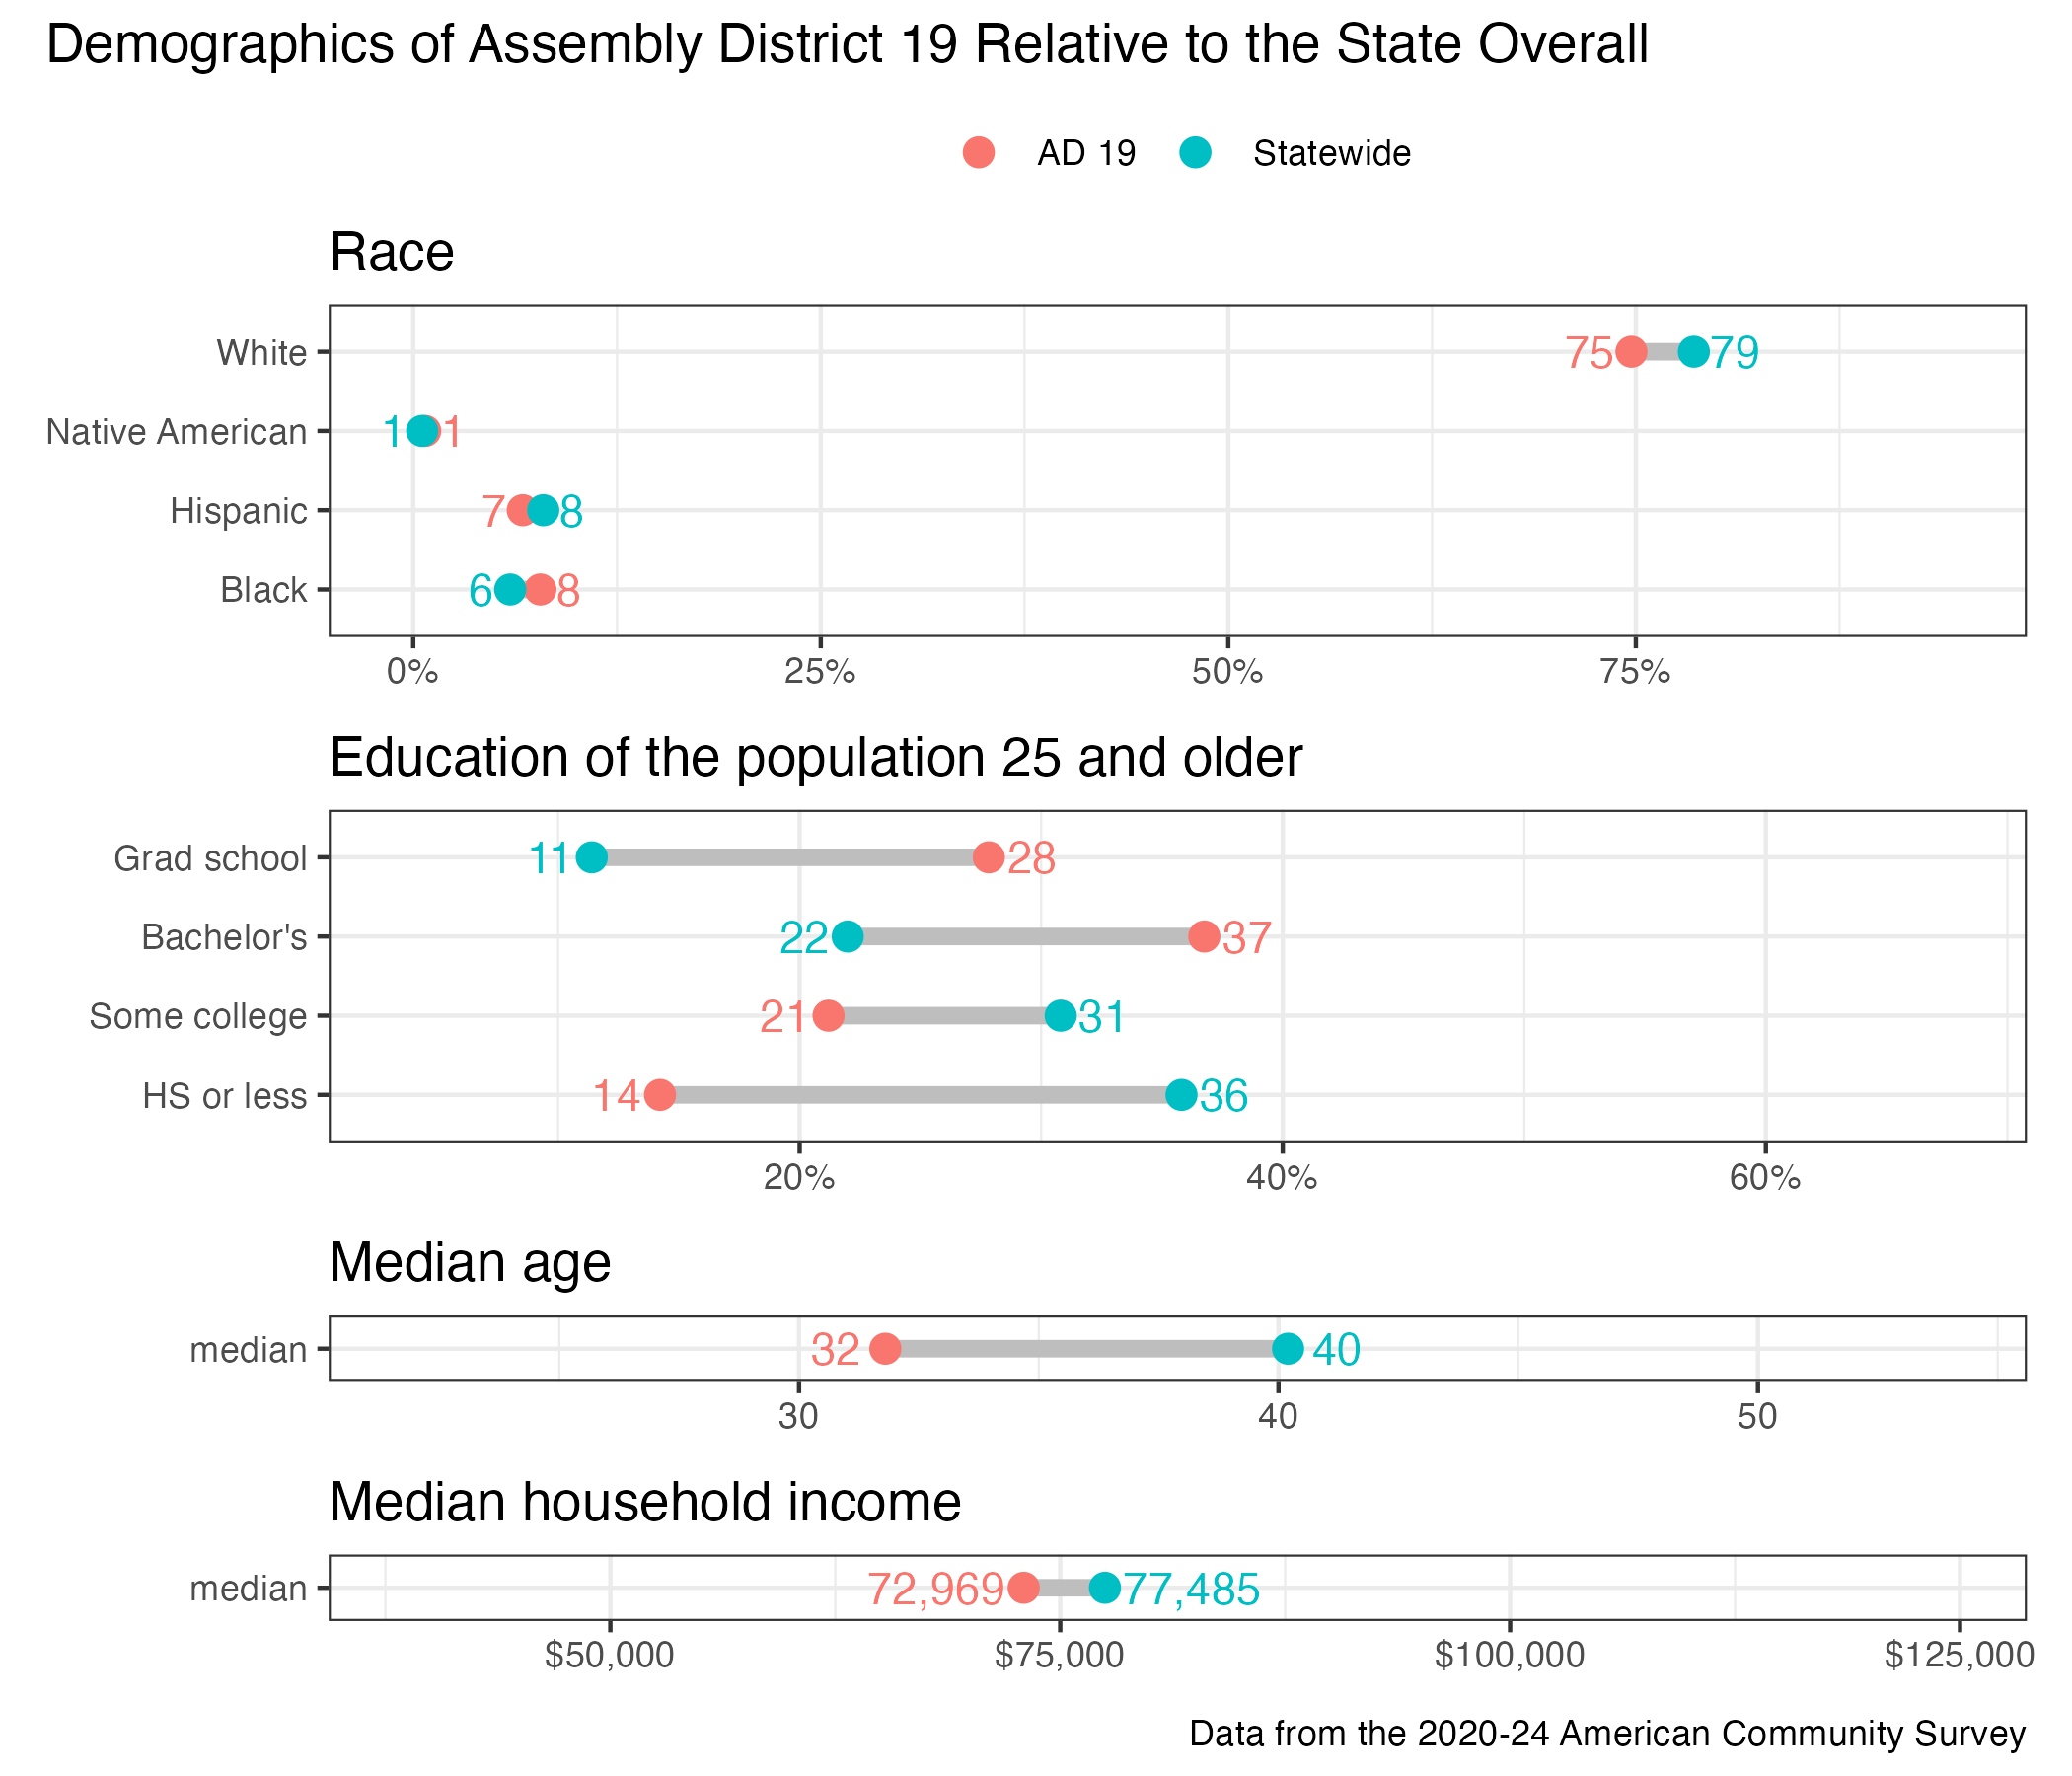
District demographics