78th Assembly District
District
Candidates
| Assembly District 78 Candidates on the Primary Ballot | ||
| Incumbent: Shelia Stubbs | ||
Jan 1 thru July 30
|
||
|---|---|---|
| receipts | disbursements | |
| Republican | ||
| Henry Johnson | $0.00 | $0.00 |
| Democratic | ||
| Shelia Stubbs | $14,010.00 | $8,569.30 |
| Data from the 2026 July Continuing Report. Any amended reports might not yet be shown. | ||
Past election results
| Election Results in Wisconsin State Assembly District 78 | ||||||
votes
|
Dem. %1 |
margin (Dem. - Rep.)
|
||||
|---|---|---|---|---|---|---|
| total | Dem. | Rep. | votes | points2 | ||
| 2016 President | 32,707 | 24,452 | 6,266 | 79.6% | +18,186 | +59.2 |
| 2016 Senator | 32,407 | 25,117 | 6,666 | 79.0% | +18,451 | +58.1 |
| 2018 Governor | 31,255 | 24,848 | 5,846 | 81.0% | +19,002 | +61.9 |
| 2018 Senator | 31,168 | 25,528 | 5,593 | 82.0% | +19,935 | +64.1 |
| 2020 President | 36,365 | 29,016 | 6,752 | 81.1% | +22,264 | +62.2 |
| 2022 Governor | 30,756 | 25,632 | 4,903 | 83.9% | +20,729 | +67.9 |
| 2022 Senator | 30,719 | 25,224 | 5,438 | 82.3% | +19,786 | +64.5 |
| 2024 President | 36,513 | 29,213 | 6,685 | 81.4% | +22,528 | +62.8 |
| 2024 Senator | 36,308 | 29,310 | 6,437 | 82.0% | +22,873 | +64.0 |
| 2024 WI Assembly | 30,198 | 29,638 | 0 | 100.0% | +29,638 | +100.0 |
| 2025 WI Sup. Ct.3 | 28,721 | 24,723 | 3,971 | 86.2% | +20,752 | +72.3 |
| 1 Share of the two-party vote. For Rep. share, subtract from 100. | ||||||
| 2 Dem % of the two-party vote minus Rep % of the two-party vote | ||||||
| 3 Formally nonpartisan candidates assigned party labels based on state endorsements | ||||||
| Election results allocated into 2024 district boundaries based on population overlap. Calculations by John Johnson (johndjohnson.info). | ||||||
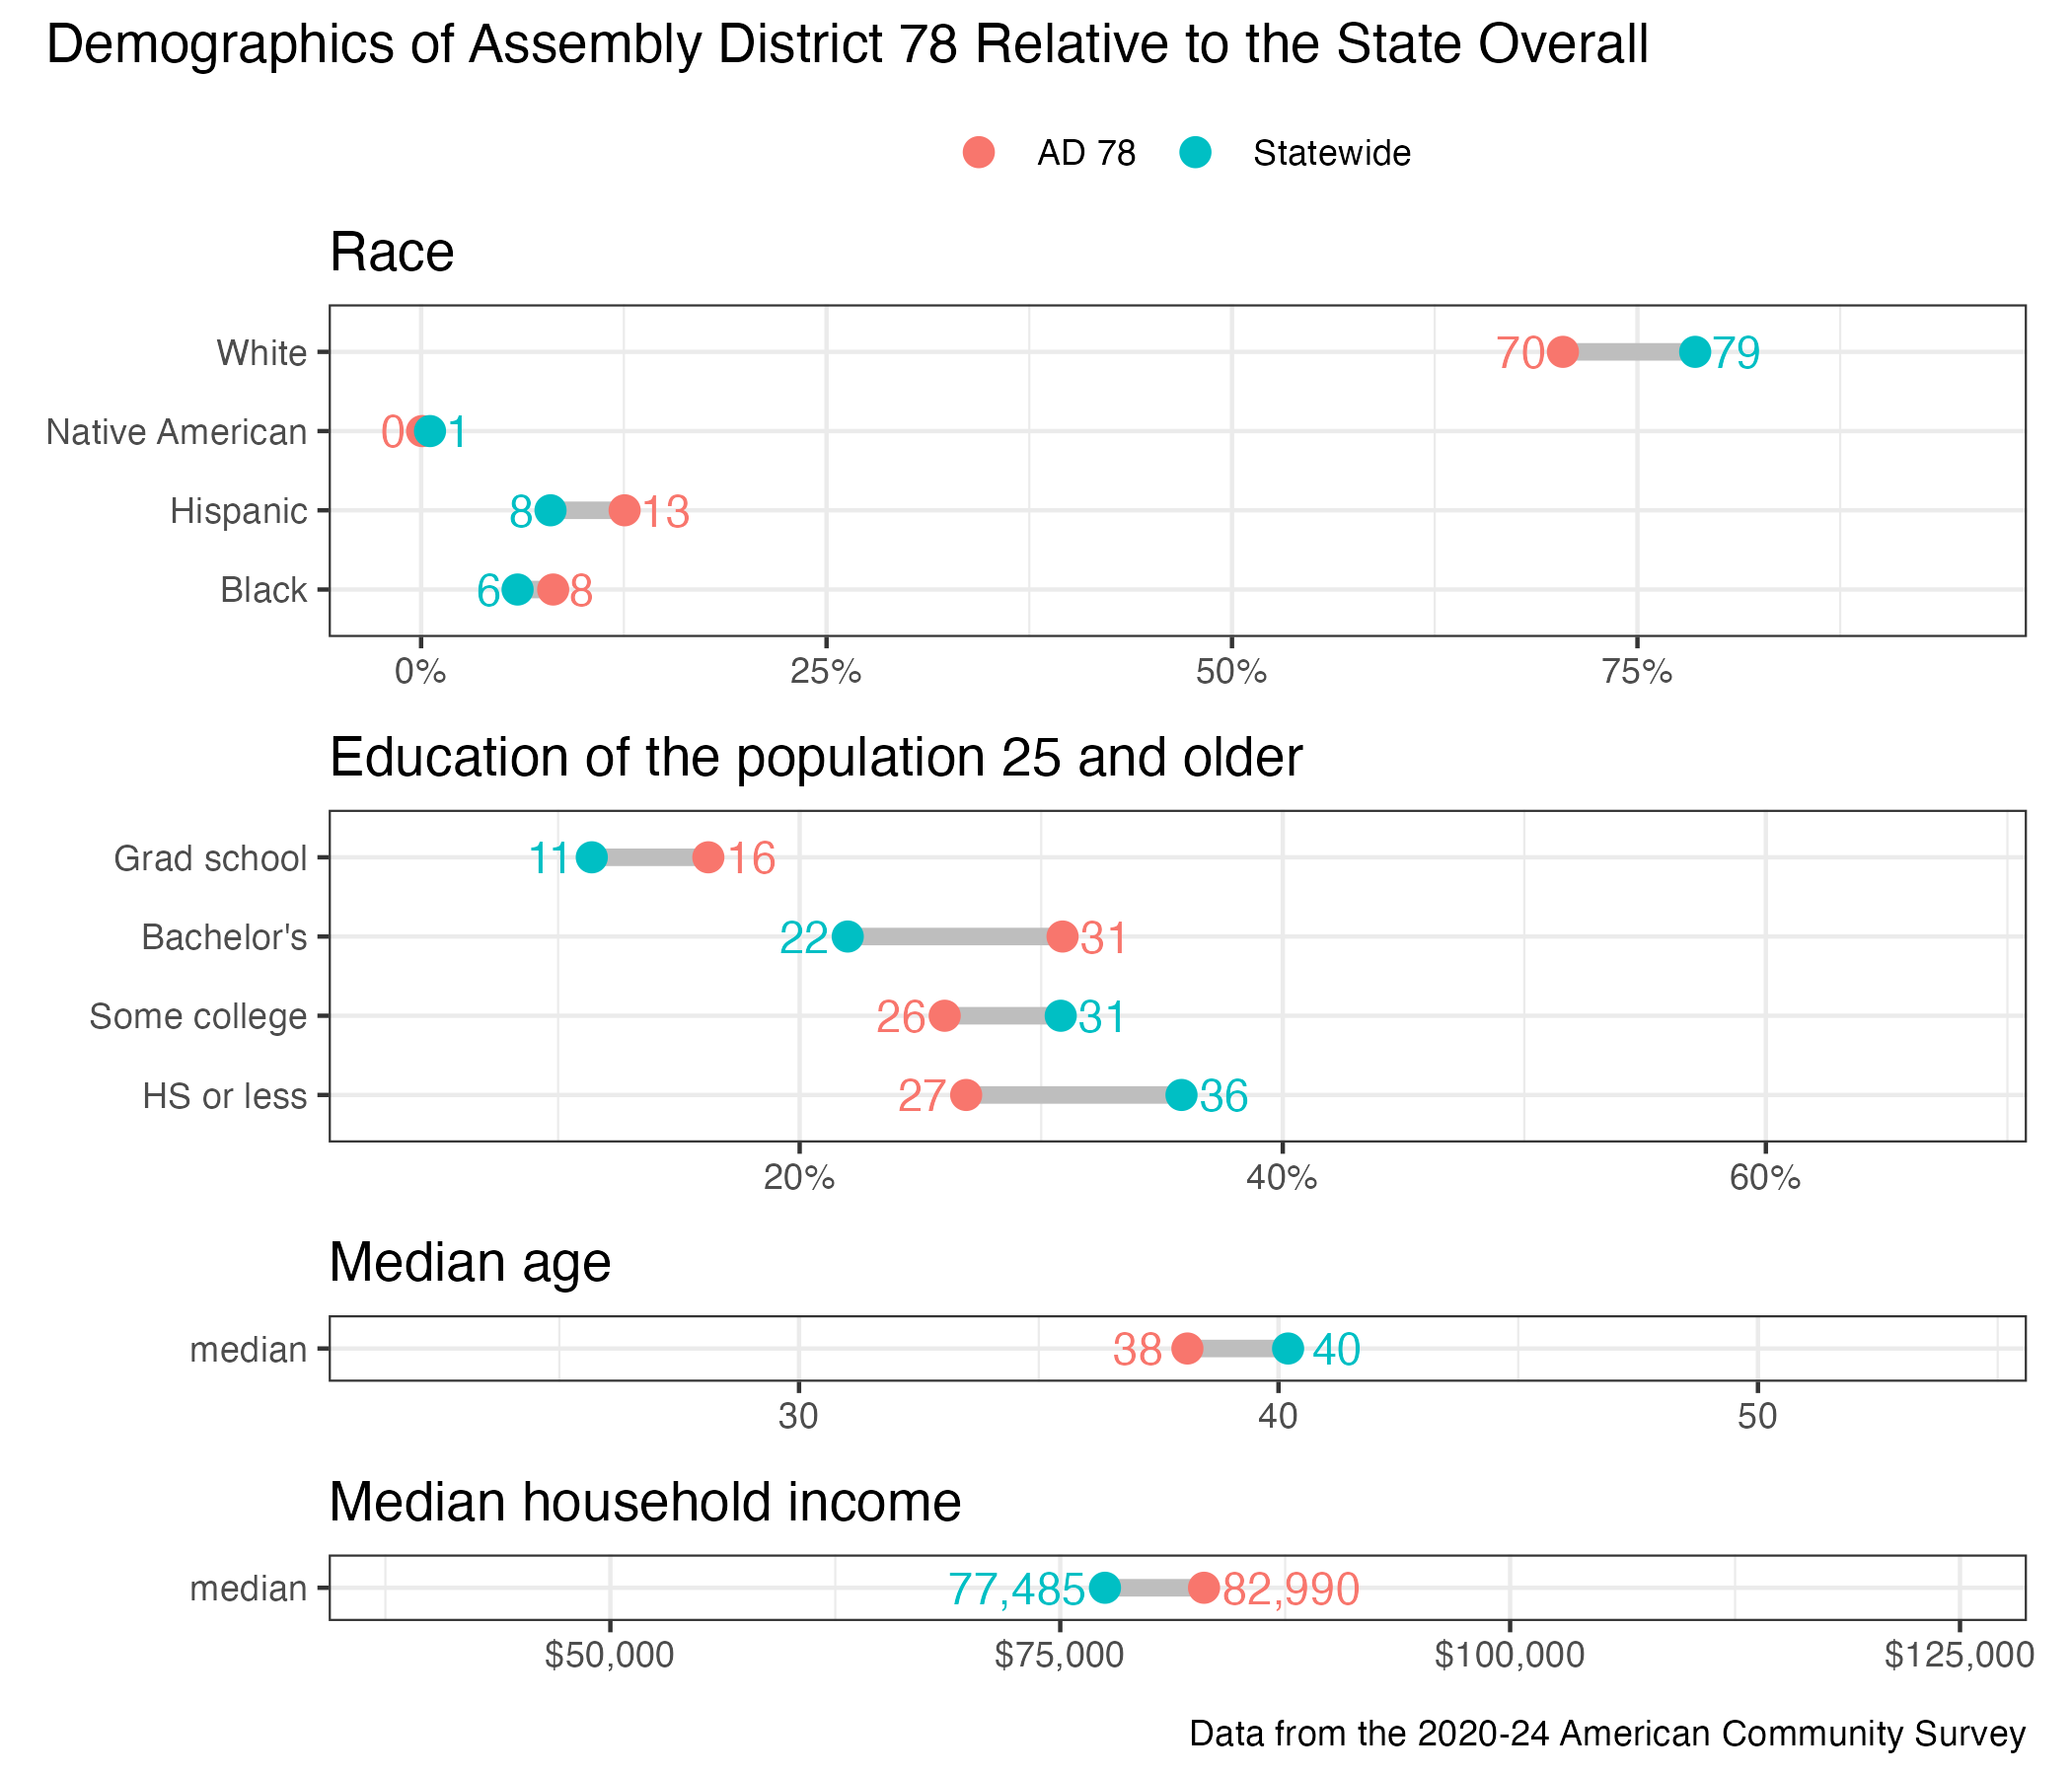
District demographics