23rd Senate District
District
Candidates
| Senate District 23 Candidates on the Primary Ballot | ||
| Incumbent: Jesse James (Filed Notification of Noncandidacy) | ||
Jan 1 thru July 30
|
||
|---|---|---|
| receipts | disbursements | |
| Republican | ||
| Romaine Robert Quinn | $44,190.00 | $54,016.49 |
| Democratic | ||
| Richard Pulcher | NA | NA |
| Jeff Foster | $5,378.05 | $1,942.71 |
| Data from the 2026 July Continuing Report. Any amended reports might not yet be shown. | ||
Past election results
| Election Results in Wisconsin State Senate District 23 | ||||||
votes
|
Dem. %1 |
margin (Dem. - Rep.)
|
||||
|---|---|---|---|---|---|---|
| total | Dem. | Rep. | votes | points2 | ||
| 2016 President | 84,491 | 27,009 | 53,112 | 33.7% | −26,103 | −32.6 |
| 2016 Senator | 83,597 | 30,161 | 50,007 | 37.6% | −19,846 | −24.8 |
| 2018 Governor | 71,902 | 26,217 | 44,464 | 37.1% | −18,247 | −25.8 |
| 2018 Senator | 71,489 | 31,600 | 39,858 | 44.2% | −8,258 | −11.6 |
| 2020 President | 94,496 | 30,694 | 62,105 | 33.1% | −31,411 | −33.8 |
| 2022 Governor | 76,113 | 25,919 | 49,009 | 34.6% | −23,090 | −30.8 |
| 2022 Senator | 75,761 | 24,140 | 51,525 | 31.9% | −27,385 | −36.2 |
| 2024 President | 99,125 | 30,755 | 66,217 | 31.7% | −35,462 | −36.6 |
| 2024 Senator | 98,213 | 32,079 | 63,458 | 33.6% | −31,379 | −32.8 |
| 2024 NA | NA | NA | NA | NA | NA | NA |
| 2025 WI Sup. Ct.3 | 66,914 | 24,718 | 42,169 | 37.0% | −17,451 | −26.1 |
| 1 Share of the two-party vote. For Rep. share, subtract from 100. | ||||||
| 2 Dem % of the two-party vote minus Rep % of the two-party vote | ||||||
| 3 Formally nonpartisan candidates assigned party labels based on state endorsements | ||||||
| Election results allocated into 2024 district boundaries based on population overlap. Calculations by John Johnson (johndjohnson.info). | ||||||
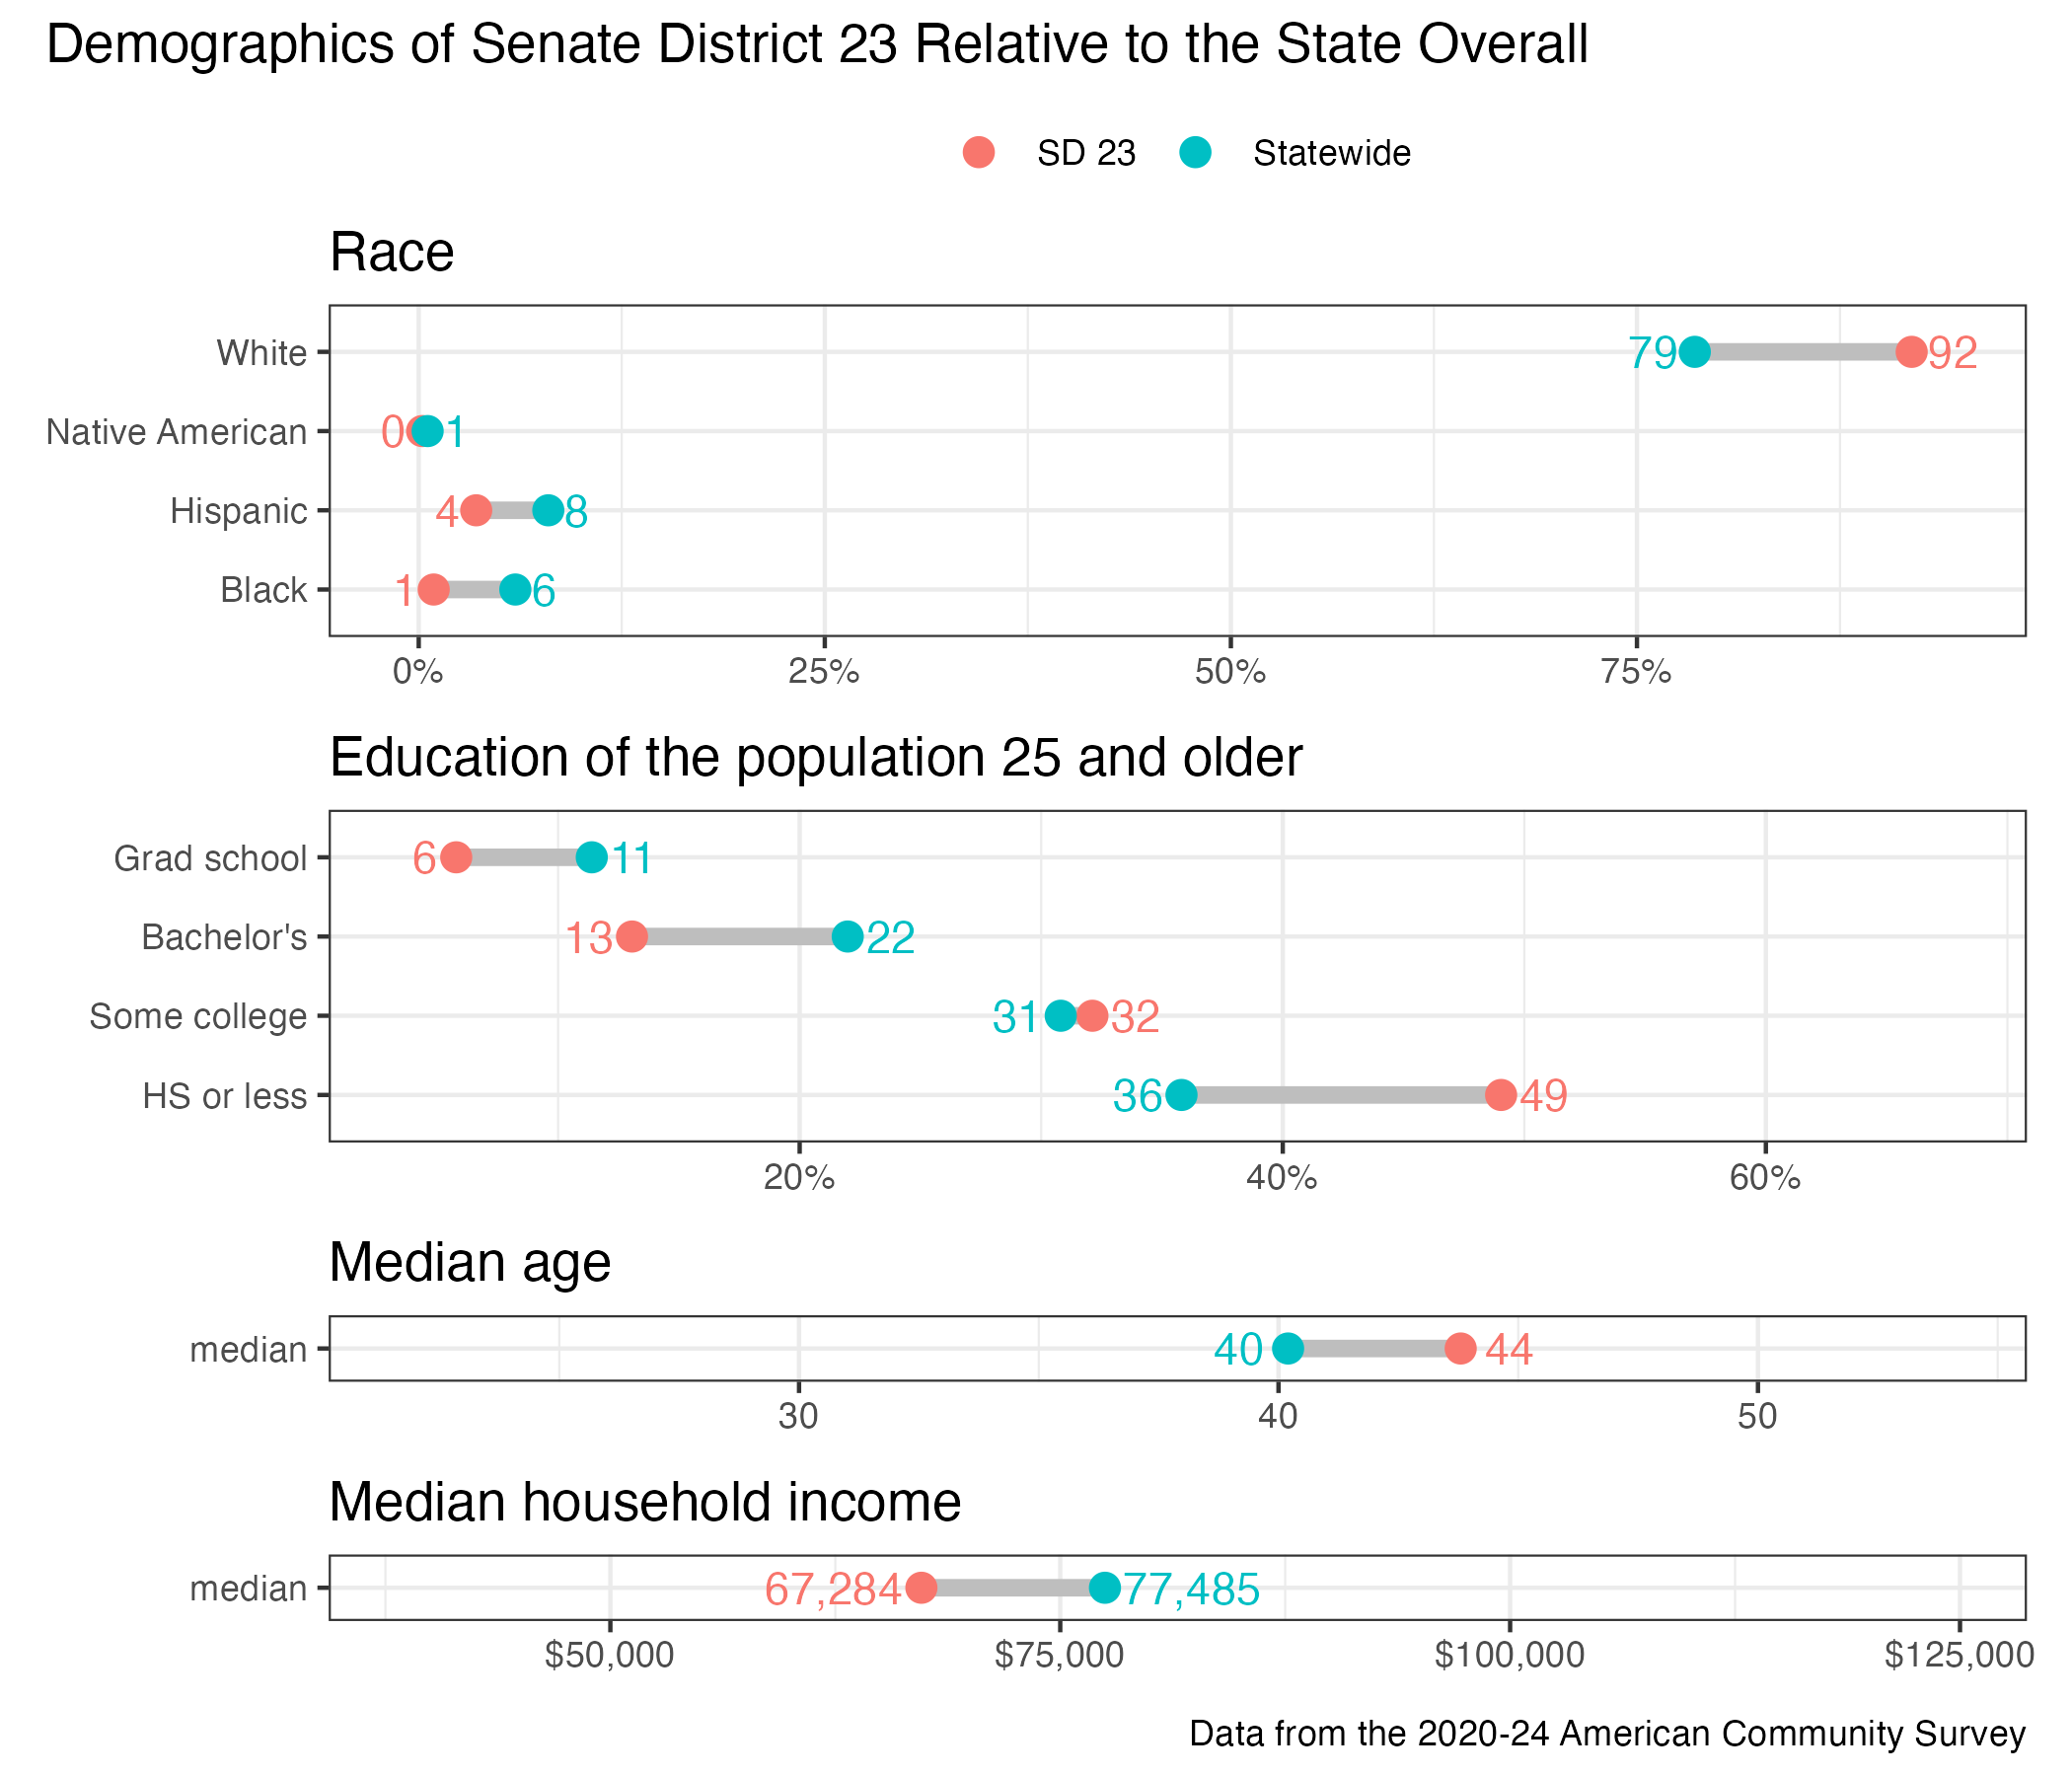
District demographics