19th Senate District
District
Candidates
| Senate District 19 Candidates on the Primary Ballot | ||
| Incumbent: Rachael Cabral-Guevara | ||
Jan 1 thru July 30
|
||
|---|---|---|
| receipts | disbursements | |
| Republican | ||
| Rachael Ann Cabral-Guevara | $31,990.67 | $29,403.44 |
| Democratic | ||
| Emily Daniels Tseffos | $29,167.20 | $5,780.57 |
| Data from the 2026 July Continuing Report. Any amended reports might not yet be shown. | ||
Past election results
| Election Results in Wisconsin State Senate District 19 | ||||||
votes
|
Dem. %1 |
margin (Dem. - Rep.)
|
||||
|---|---|---|---|---|---|---|
| total | Dem. | Rep. | votes | points2 | ||
| 2016 President | 92,161 | 31,140 | 55,679 | 35.9% | −24,539 | −28.3 |
| 2016 Senator | 91,540 | 30,490 | 57,845 | 34.5% | −27,355 | −31.0 |
| 2018 Governor | 84,088 | 31,290 | 51,297 | 37.9% | −20,007 | −24.2 |
| 2018 Senator | 83,708 | 36,547 | 47,113 | 43.7% | −10,566 | −12.6 |
| 2020 President | 107,704 | 39,402 | 66,413 | 37.2% | −27,011 | −25.5 |
| 2022 Governor | 88,730 | 33,493 | 54,311 | 38.1% | −20,818 | −23.7 |
| 2022 Senator | 88,453 | 31,682 | 56,674 | 35.9% | −24,992 | −28.3 |
| 2024 President | 112,701 | 41,027 | 70,091 | 36.9% | −29,064 | −26.2 |
| 2024 Senator | 111,813 | 41,165 | 67,946 | 37.7% | −26,781 | −24.5 |
| 2024 NA | NA | NA | NA | NA | NA | NA |
| 2025 WI Sup. Ct.3 | 77,303 | 32,141 | 45,140 | 41.6% | −12,999 | −16.8 |
| 1 Share of the two-party vote. For Rep. share, subtract from 100. | ||||||
| 2 Dem % of the two-party vote minus Rep % of the two-party vote | ||||||
| 3 Formally nonpartisan candidates assigned party labels based on state endorsements | ||||||
| Election results allocated into 2024 district boundaries based on population overlap. Calculations by John Johnson (johndjohnson.info). | ||||||
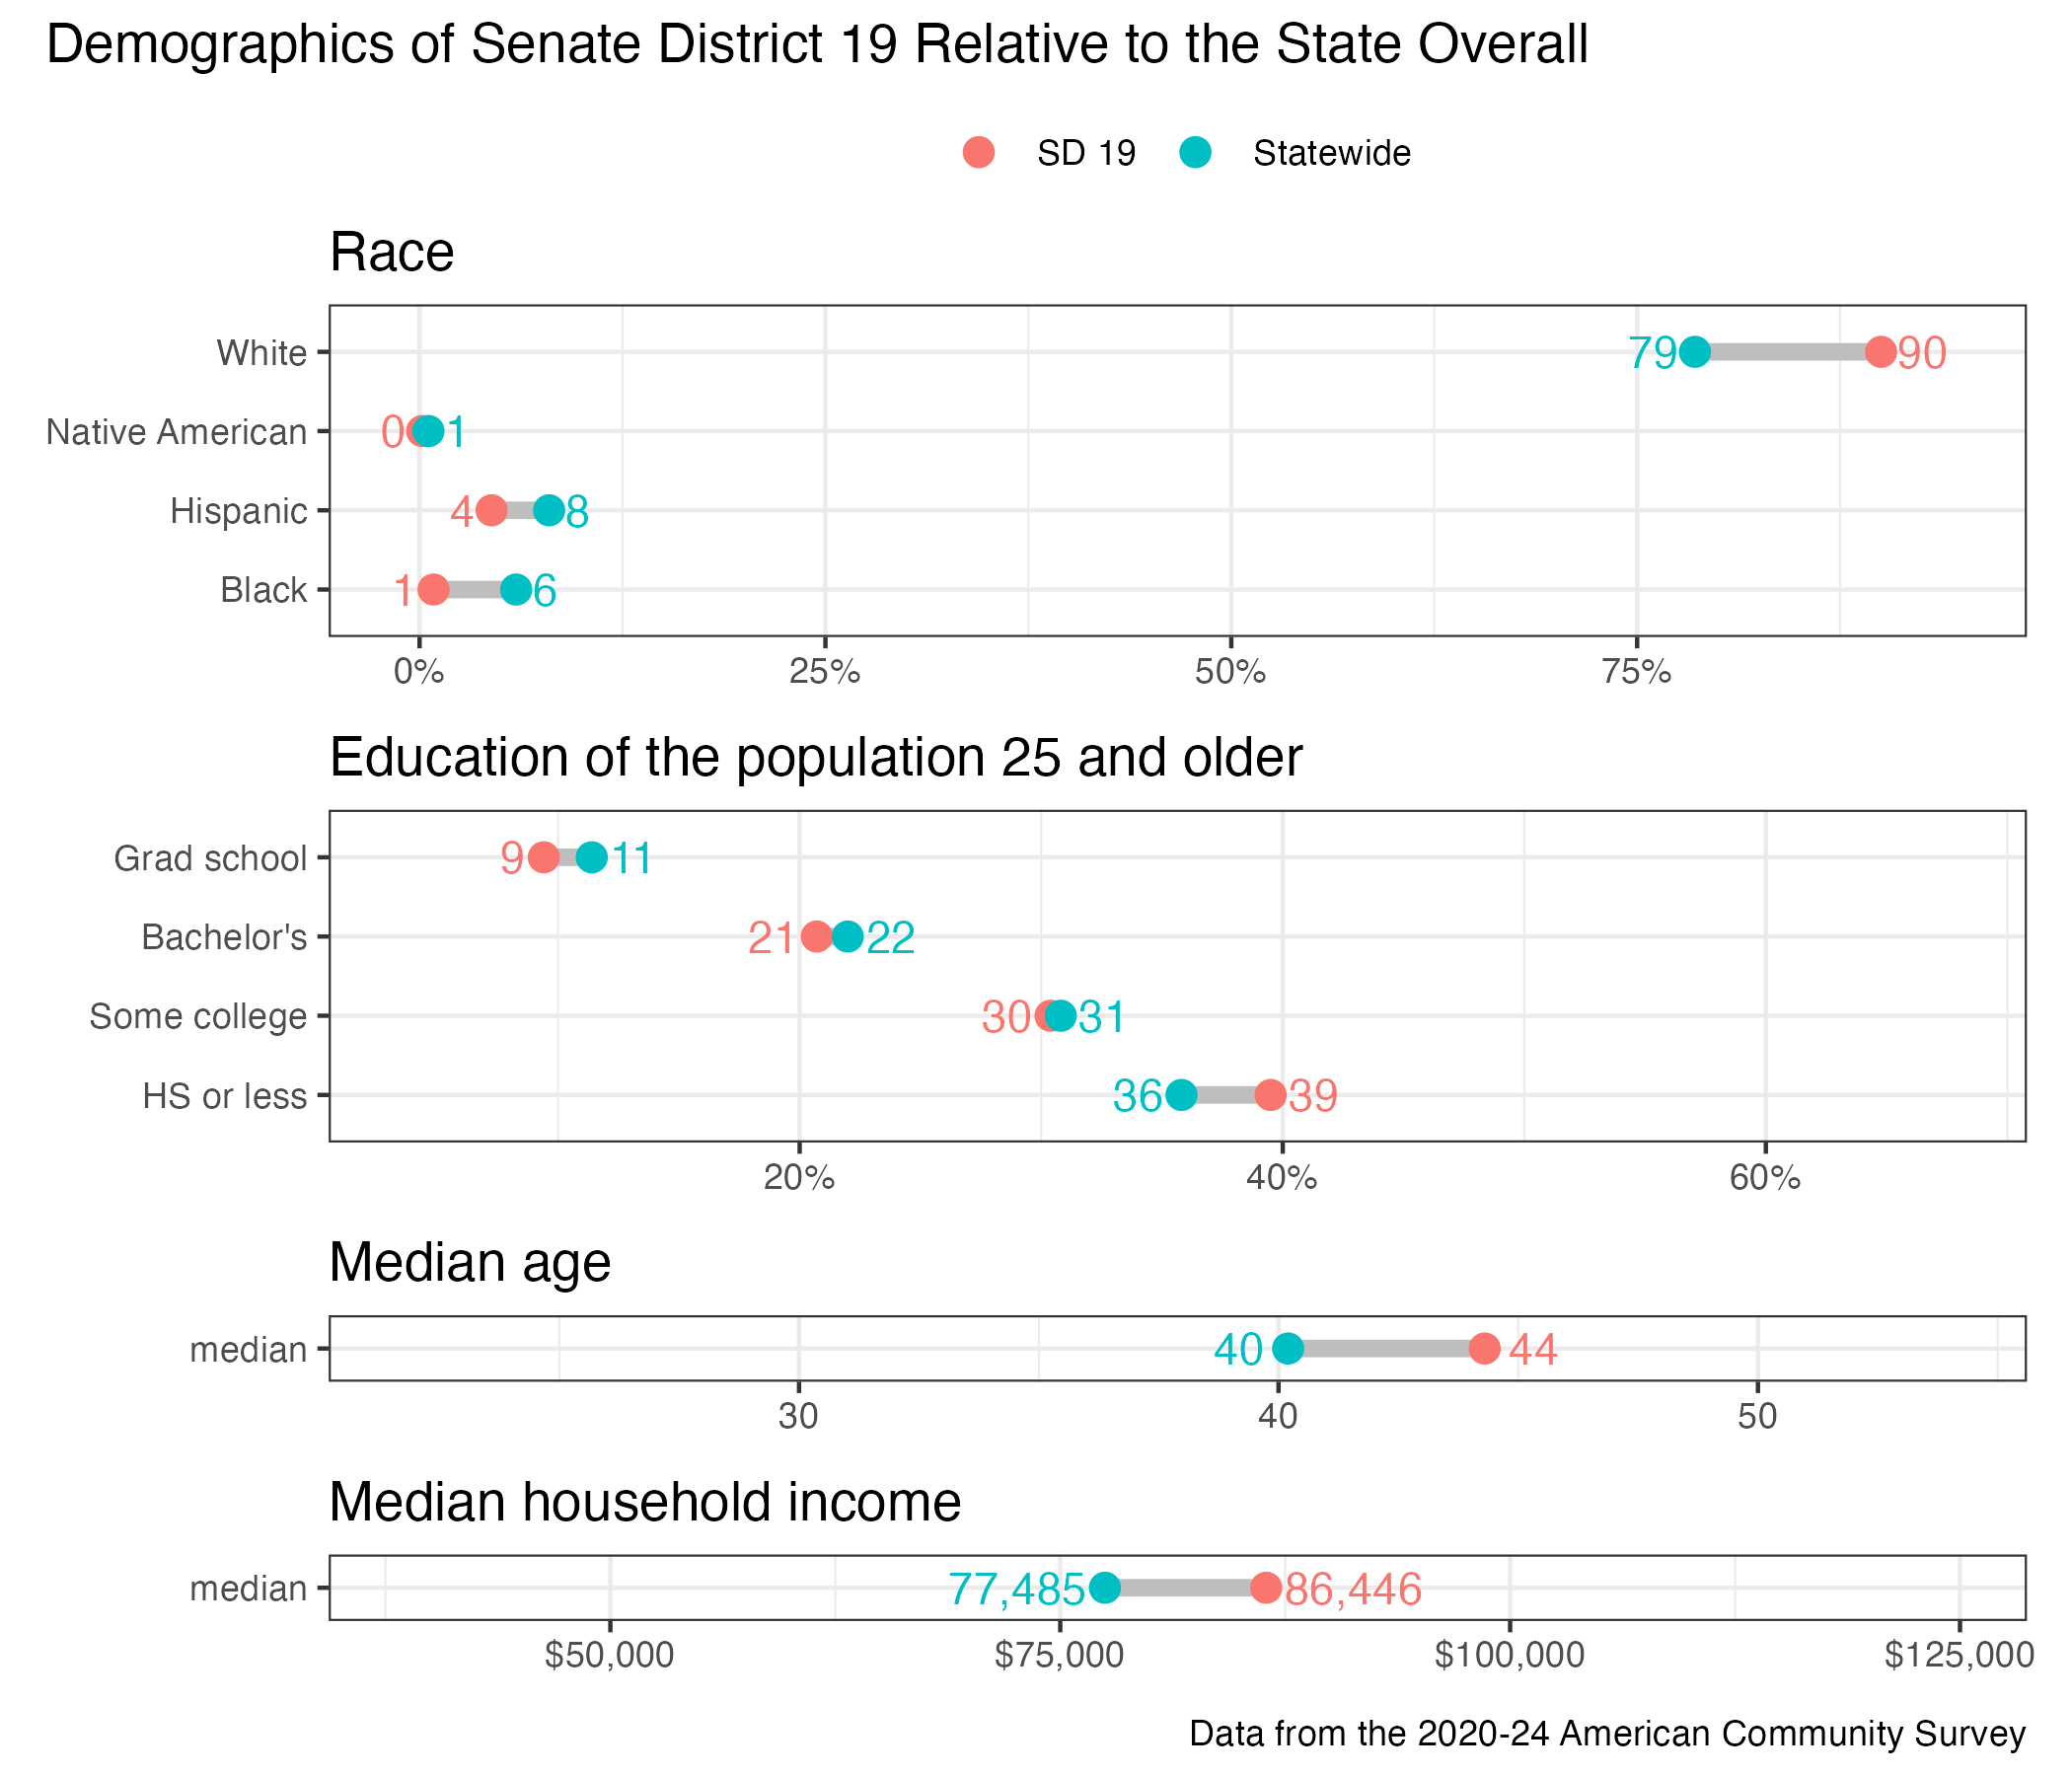
District demographics