45th Assembly District
District
Candidates
| Assembly District 45 Candidates on the Primary Ballot | ||
| Incumbent: Clinton Anderson | ||
Jan 1 thru July 30
|
||
|---|---|---|
| receipts | disbursements | |
| Republican | ||
| Jocelyn Jordan | NA | NA |
| Democratic | ||
| Clinton Anderson | $22,253.00 | $23,019.07 |
| Data from the 2026 July Continuing Report. Any amended reports might not yet be shown. | ||
Past election results
| Election Results in Wisconsin State Assembly District 45 | ||||||
votes
|
Dem. %1 |
margin (Dem. - Rep.)
|
||||
|---|---|---|---|---|---|---|
| total | Dem. | Rep. | votes | points2 | ||
| 2016 President | 25,638 | 13,654 | 10,372 | 56.8% | +3,282 | +13.7 |
| 2016 Senator | 25,222 | 14,419 | 9,875 | 59.4% | +4,544 | +18.7 |
| 2018 Governor | 22,637 | 13,216 | 8,796 | 60.0% | +4,420 | +20.1 |
| 2018 Senator | 22,531 | 14,325 | 8,183 | 63.6% | +6,142 | +27.3 |
| 2020 President | 28,299 | 15,495 | 12,325 | 55.7% | +3,170 | +11.4 |
| 2022 Governor | 20,478 | 11,677 | 8,517 | 57.8% | +3,160 | +15.6 |
| 2022 Senator | 20,355 | 11,116 | 9,182 | 54.8% | +1,934 | +9.5 |
| 2024 President | 28,709 | 15,199 | 13,115 | 53.7% | +2,084 | +7.4 |
| 2024 Senator | 28,368 | 15,386 | 12,191 | 55.8% | +3,195 | +11.6 |
| 2024 WI Assembly | 20,719 | 19,864 | 0 | 100.0% | +19,864 | +100.0 |
| 2025 WI Sup. Ct.3 | 18,354 | 11,107 | 7,230 | 60.6% | +3,877 | +21.1 |
| 1 Share of the two-party vote. For Rep. share, subtract from 100. | ||||||
| 2 Dem % of the two-party vote minus Rep % of the two-party vote | ||||||
| 3 Formally nonpartisan candidates assigned party labels based on state endorsements | ||||||
| Election results allocated into 2024 district boundaries based on population overlap. Calculations by John Johnson (johndjohnson.info). | ||||||
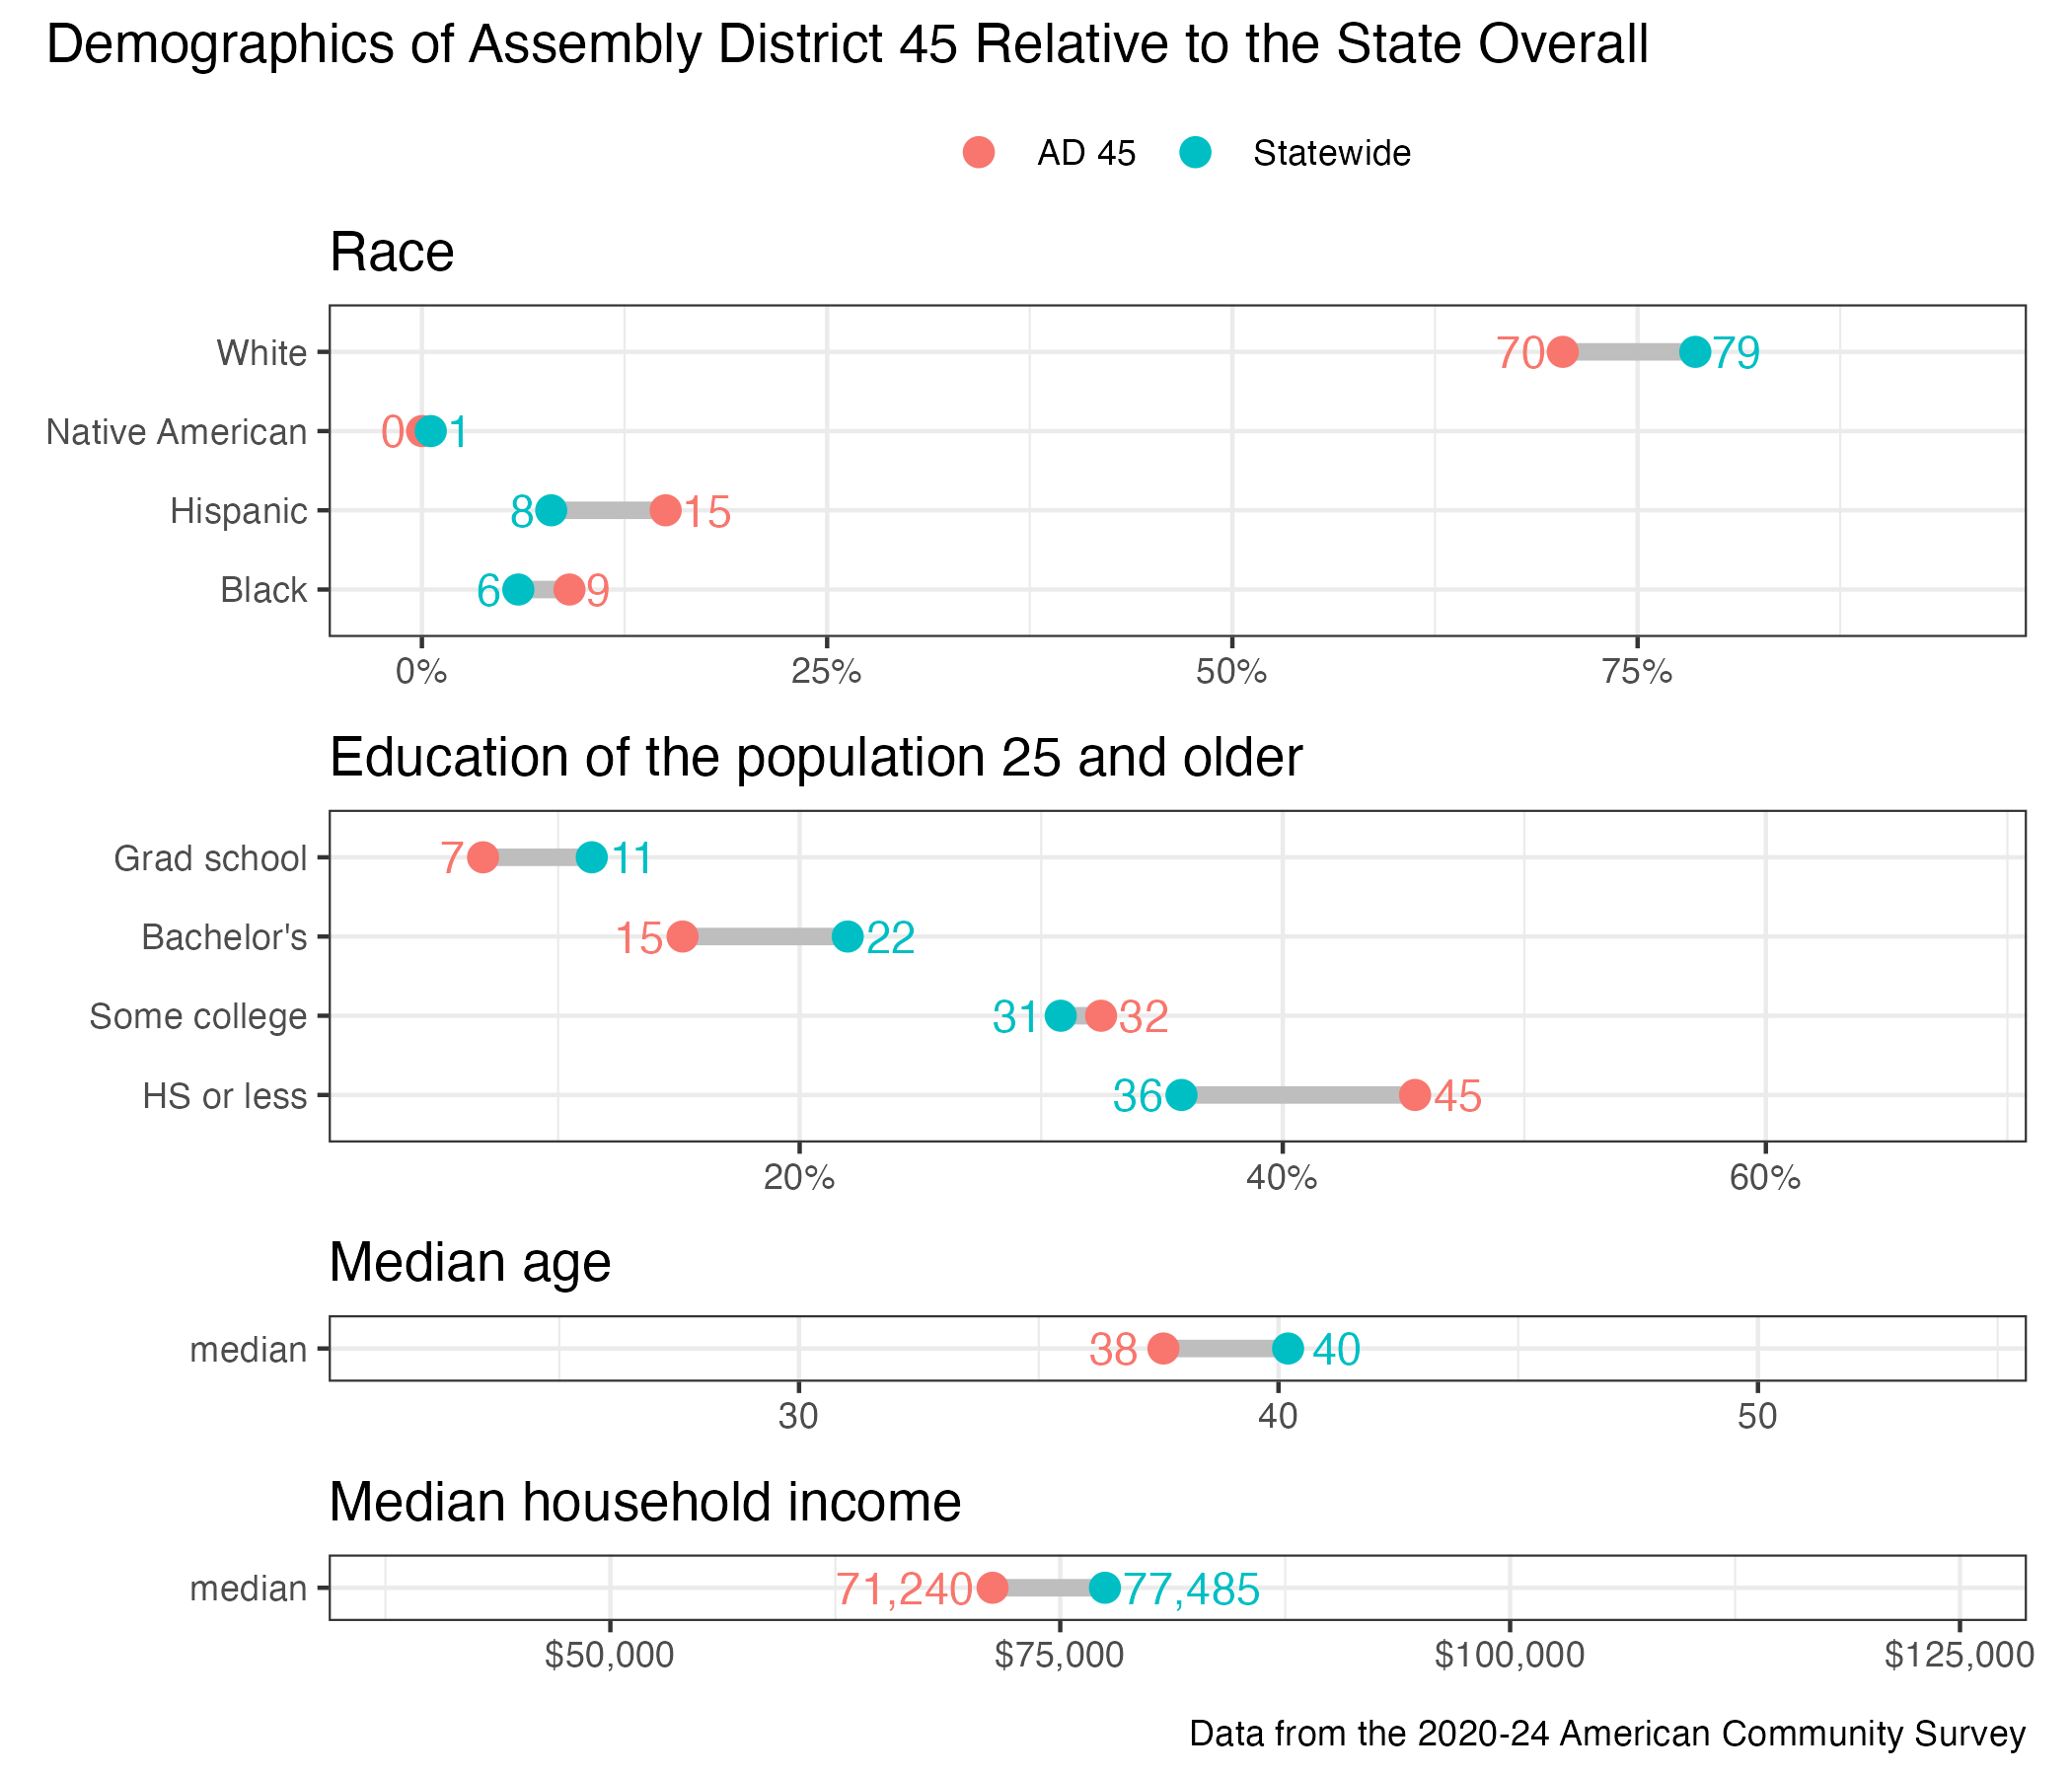
District demographics