18th Assembly District
District
Candidates
| Assembly District 18 Candidates on the Primary Ballot | ||
| Incumbent: Margaret Arney | ||
Jan 1 thru July 30
|
||
|---|---|---|
| receipts | disbursements | |
| Republican | ||
| Joel Richmond | $0.00 | $0.00 |
| Democratic | ||
| Margaret Arney | $12,015.00 | $2,939.30 |
| Data from the 2026 July Continuing Report. Any amended reports might not yet be shown. | ||
Past election results
| Election Results in Wisconsin State Assembly District 18 | ||||||
votes
|
Dem. %1 |
margin (Dem. - Rep.)
|
||||
|---|---|---|---|---|---|---|
| total | Dem. | Rep. | votes | points2 | ||
| 2016 President | 27,494 | 22,194 | 3,909 | 85.0% | +18,285 | +70.0 |
| 2016 Senator | 27,075 | 21,242 | 5,294 | 80.0% | +15,948 | +60.1 |
| 2018 Governor | 24,412 | 19,772 | 4,188 | 82.5% | +15,584 | +65.0 |
| 2018 Senator | 24,434 | 20,539 | 3,855 | 84.2% | +16,684 | +68.4 |
| 2020 President | 27,567 | 22,809 | 4,282 | 84.2% | +18,527 | +68.4 |
| 2022 Governor | 20,152 | 16,953 | 3,010 | 84.9% | +13,943 | +69.8 |
| 2022 Senator | 20,293 | 17,054 | 3,196 | 84.2% | +13,858 | +68.4 |
| 2024 President | 26,936 | 22,107 | 4,255 | 83.9% | +17,852 | +67.7 |
| 2024 Senator | 26,647 | 21,865 | 4,180 | 84.0% | +17,685 | +67.9 |
| 2024 WI Assembly | 25,308 | 20,801 | 4,431 | 82.4% | +16,370 | +64.9 |
| 2025 WI Sup. Ct.3 | 17,254 | 14,761 | 2,476 | 85.6% | +12,285 | +71.3 |
| 1 Share of the two-party vote. For Rep. share, subtract from 100. | ||||||
| 2 Dem % of the two-party vote minus Rep % of the two-party vote | ||||||
| 3 Formally nonpartisan candidates assigned party labels based on state endorsements | ||||||
| Election results allocated into 2024 district boundaries based on population overlap. Calculations by John Johnson (johndjohnson.info). | ||||||
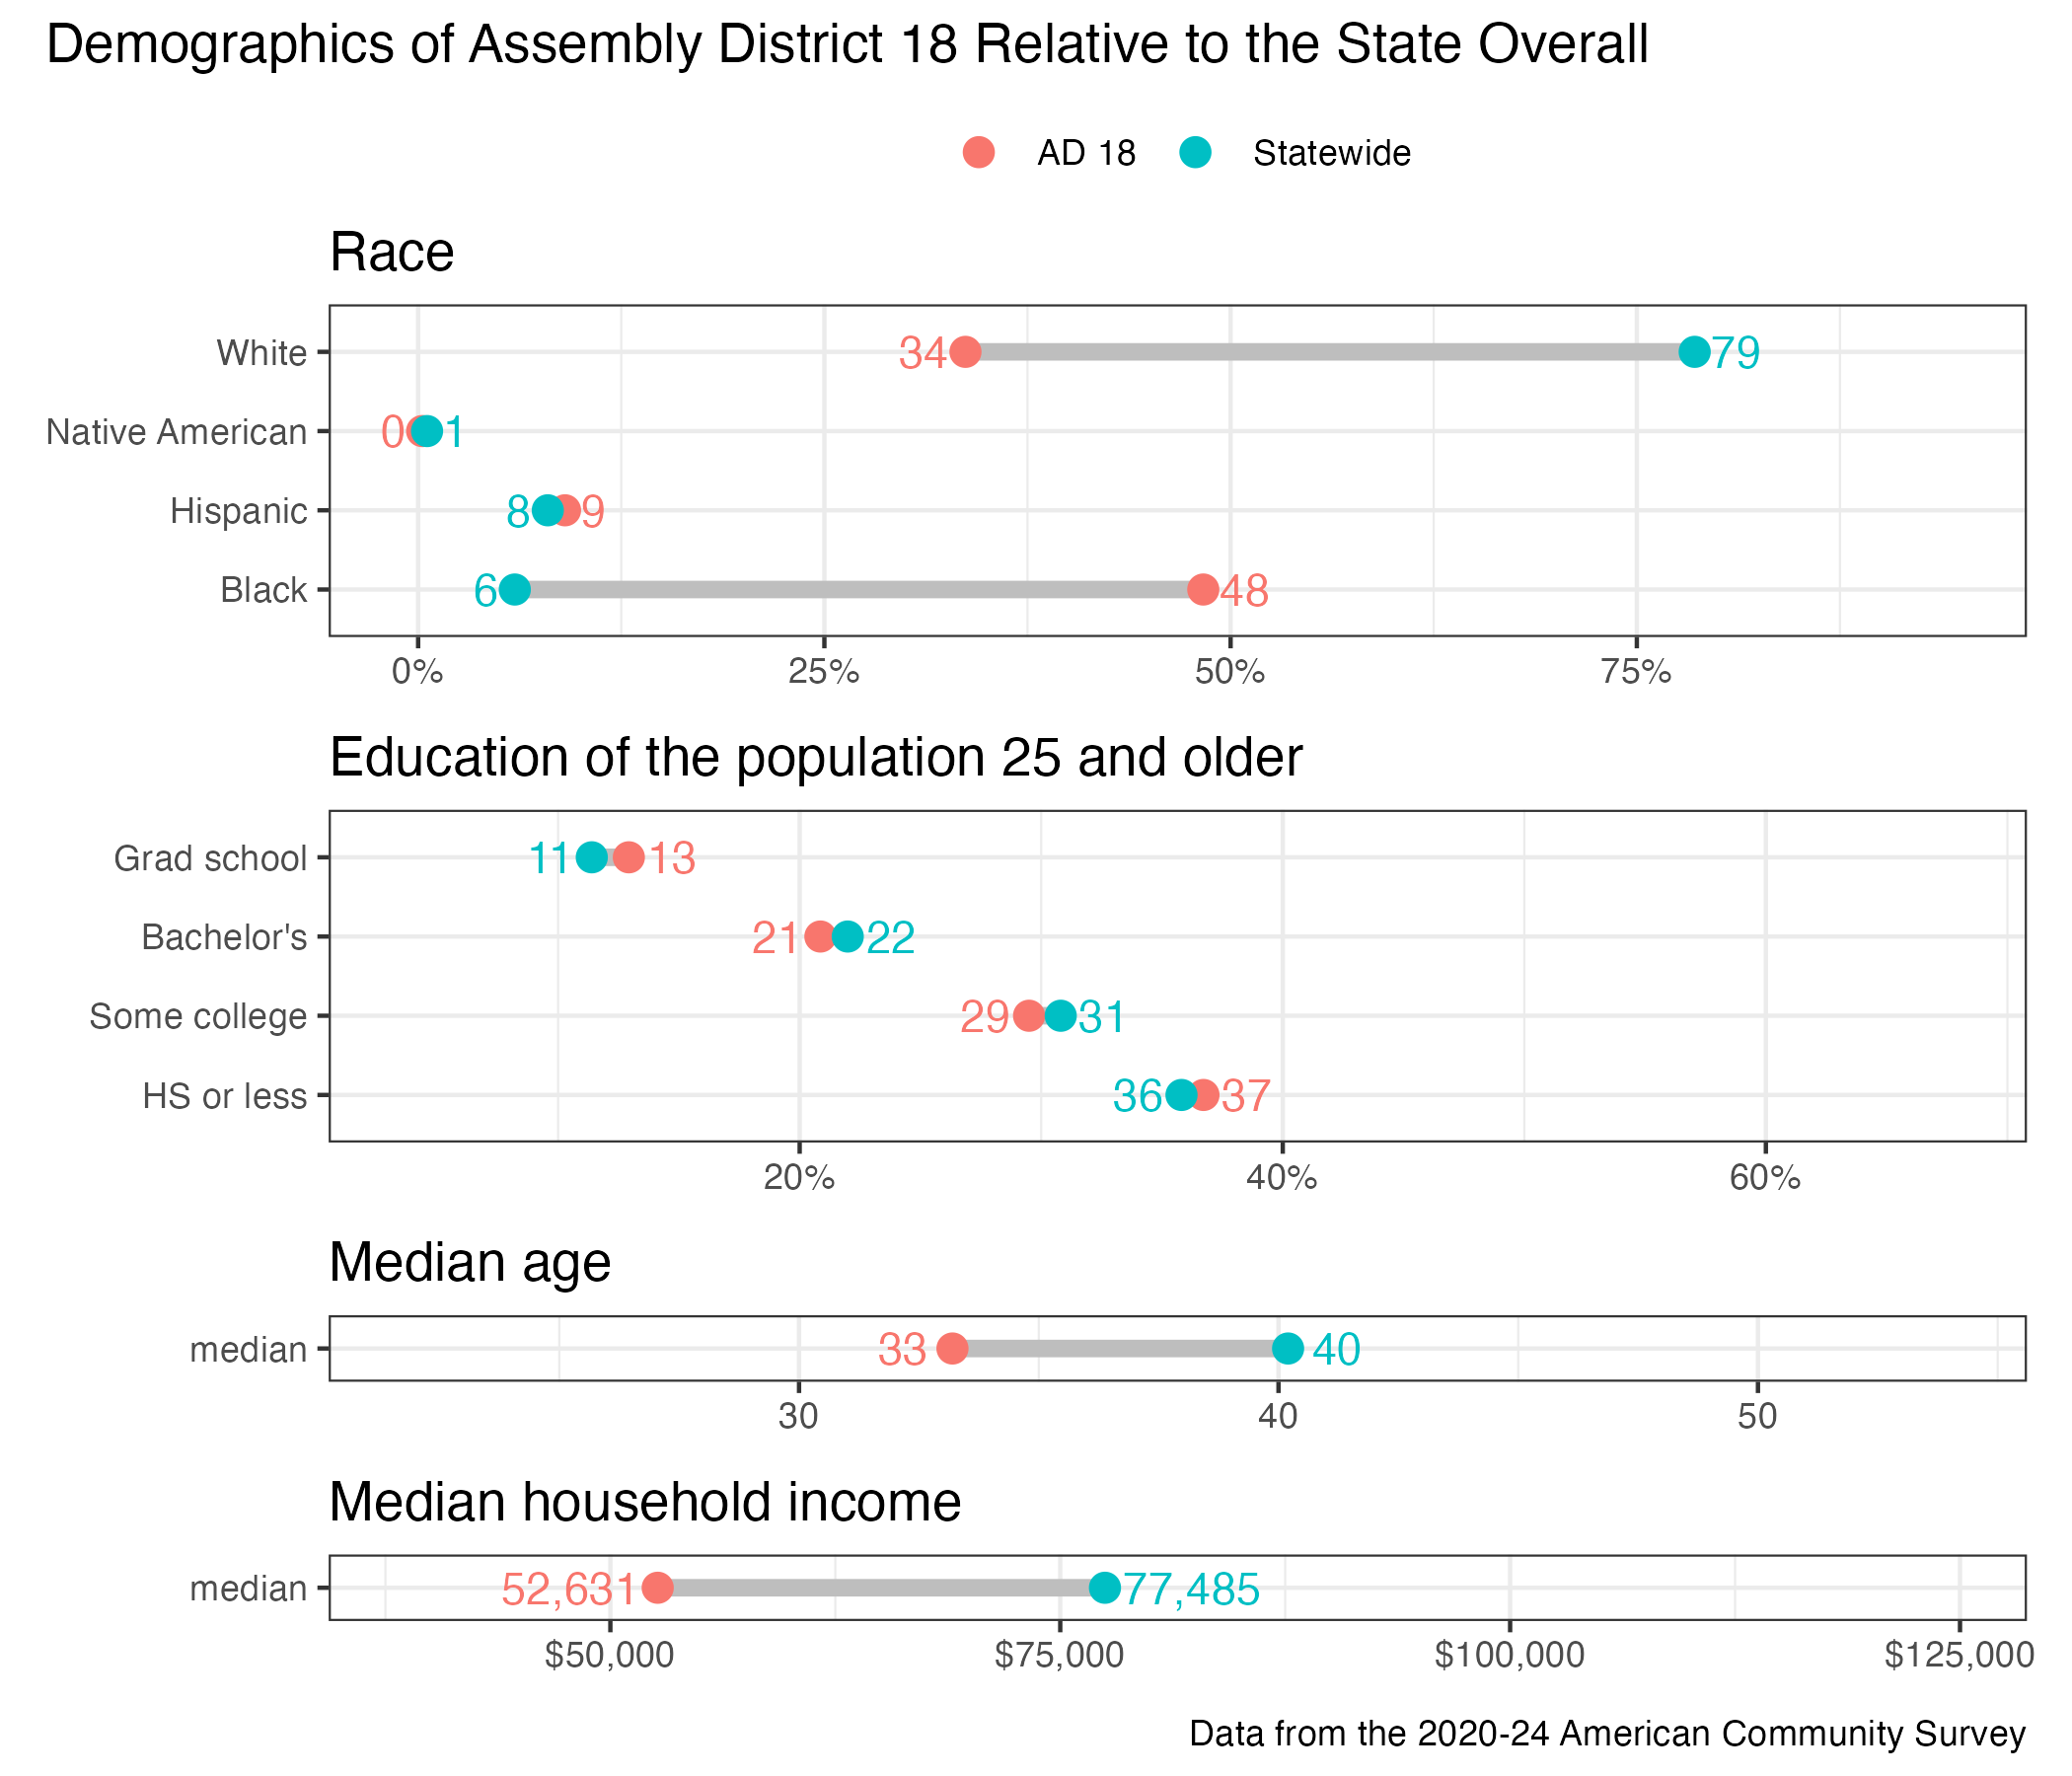
District demographics