82nd Assembly District
District
Candidates
| Assembly District 82 Candidates on the Primary Ballot | ||
| Incumbent: Scott Allen (Filed Notification of Noncandidacy) | ||
Jan 1 thru July 30
|
||
|---|---|---|
| receipts | disbursements | |
| Republican | ||
| Bryson Reyes | $20,262.53 | $3,082.77 |
| Democratic | ||
| Rico Camacho | $3,962.55 | $2,869.73 |
| Data from the 2026 July Continuing Report. Any amended reports might not yet be shown. | ||
Past election results
| Election Results in Wisconsin State Assembly District 82 | ||||||
votes
|
Dem. %1 |
margin (Dem. - Rep.)
|
||||
|---|---|---|---|---|---|---|
| total | Dem. | Rep. | votes | points2 | ||
| 2016 President | 29,993 | 11,930 | 15,622 | 43.3% | −3,692 | −13.4 |
| 2016 Senator | 29,788 | 11,116 | 17,886 | 38.3% | −6,770 | −23.3 |
| 2018 Governor | 27,079 | 10,916 | 15,630 | 41.1% | −4,714 | −17.8 |
| 2018 Senator | 26,875 | 12,364 | 14,469 | 46.1% | −2,105 | −7.8 |
| 2020 President | 32,904 | 14,797 | 17,402 | 46.0% | −2,605 | −8.1 |
| 2022 Governor | 25,760 | 11,892 | 13,629 | 46.6% | −1,737 | −6.8 |
| 2022 Senator | 25,667 | 11,303 | 14,308 | 44.1% | −3,005 | −11.7 |
| 2024 President | 33,733 | 15,213 | 17,931 | 45.9% | −2,718 | −8.2 |
| 2024 Senator | 33,372 | 14,935 | 17,753 | 45.7% | −2,818 | −8.6 |
| 2024 WI Assembly | 32,586 | 13,917 | 18,632 | 42.8% | −4,715 | −14.5 |
| 2025 WI Sup. Ct.3 | 23,096 | 11,448 | 11,633 | 49.6% | −185 | −0.8 |
| 1 Share of the two-party vote. For Rep. share, subtract from 100. | ||||||
| 2 Dem % of the two-party vote minus Rep % of the two-party vote | ||||||
| 3 Formally nonpartisan candidates assigned party labels based on state endorsements | ||||||
| Election results allocated into 2024 district boundaries based on population overlap. Calculations by John Johnson (johndjohnson.info). | ||||||
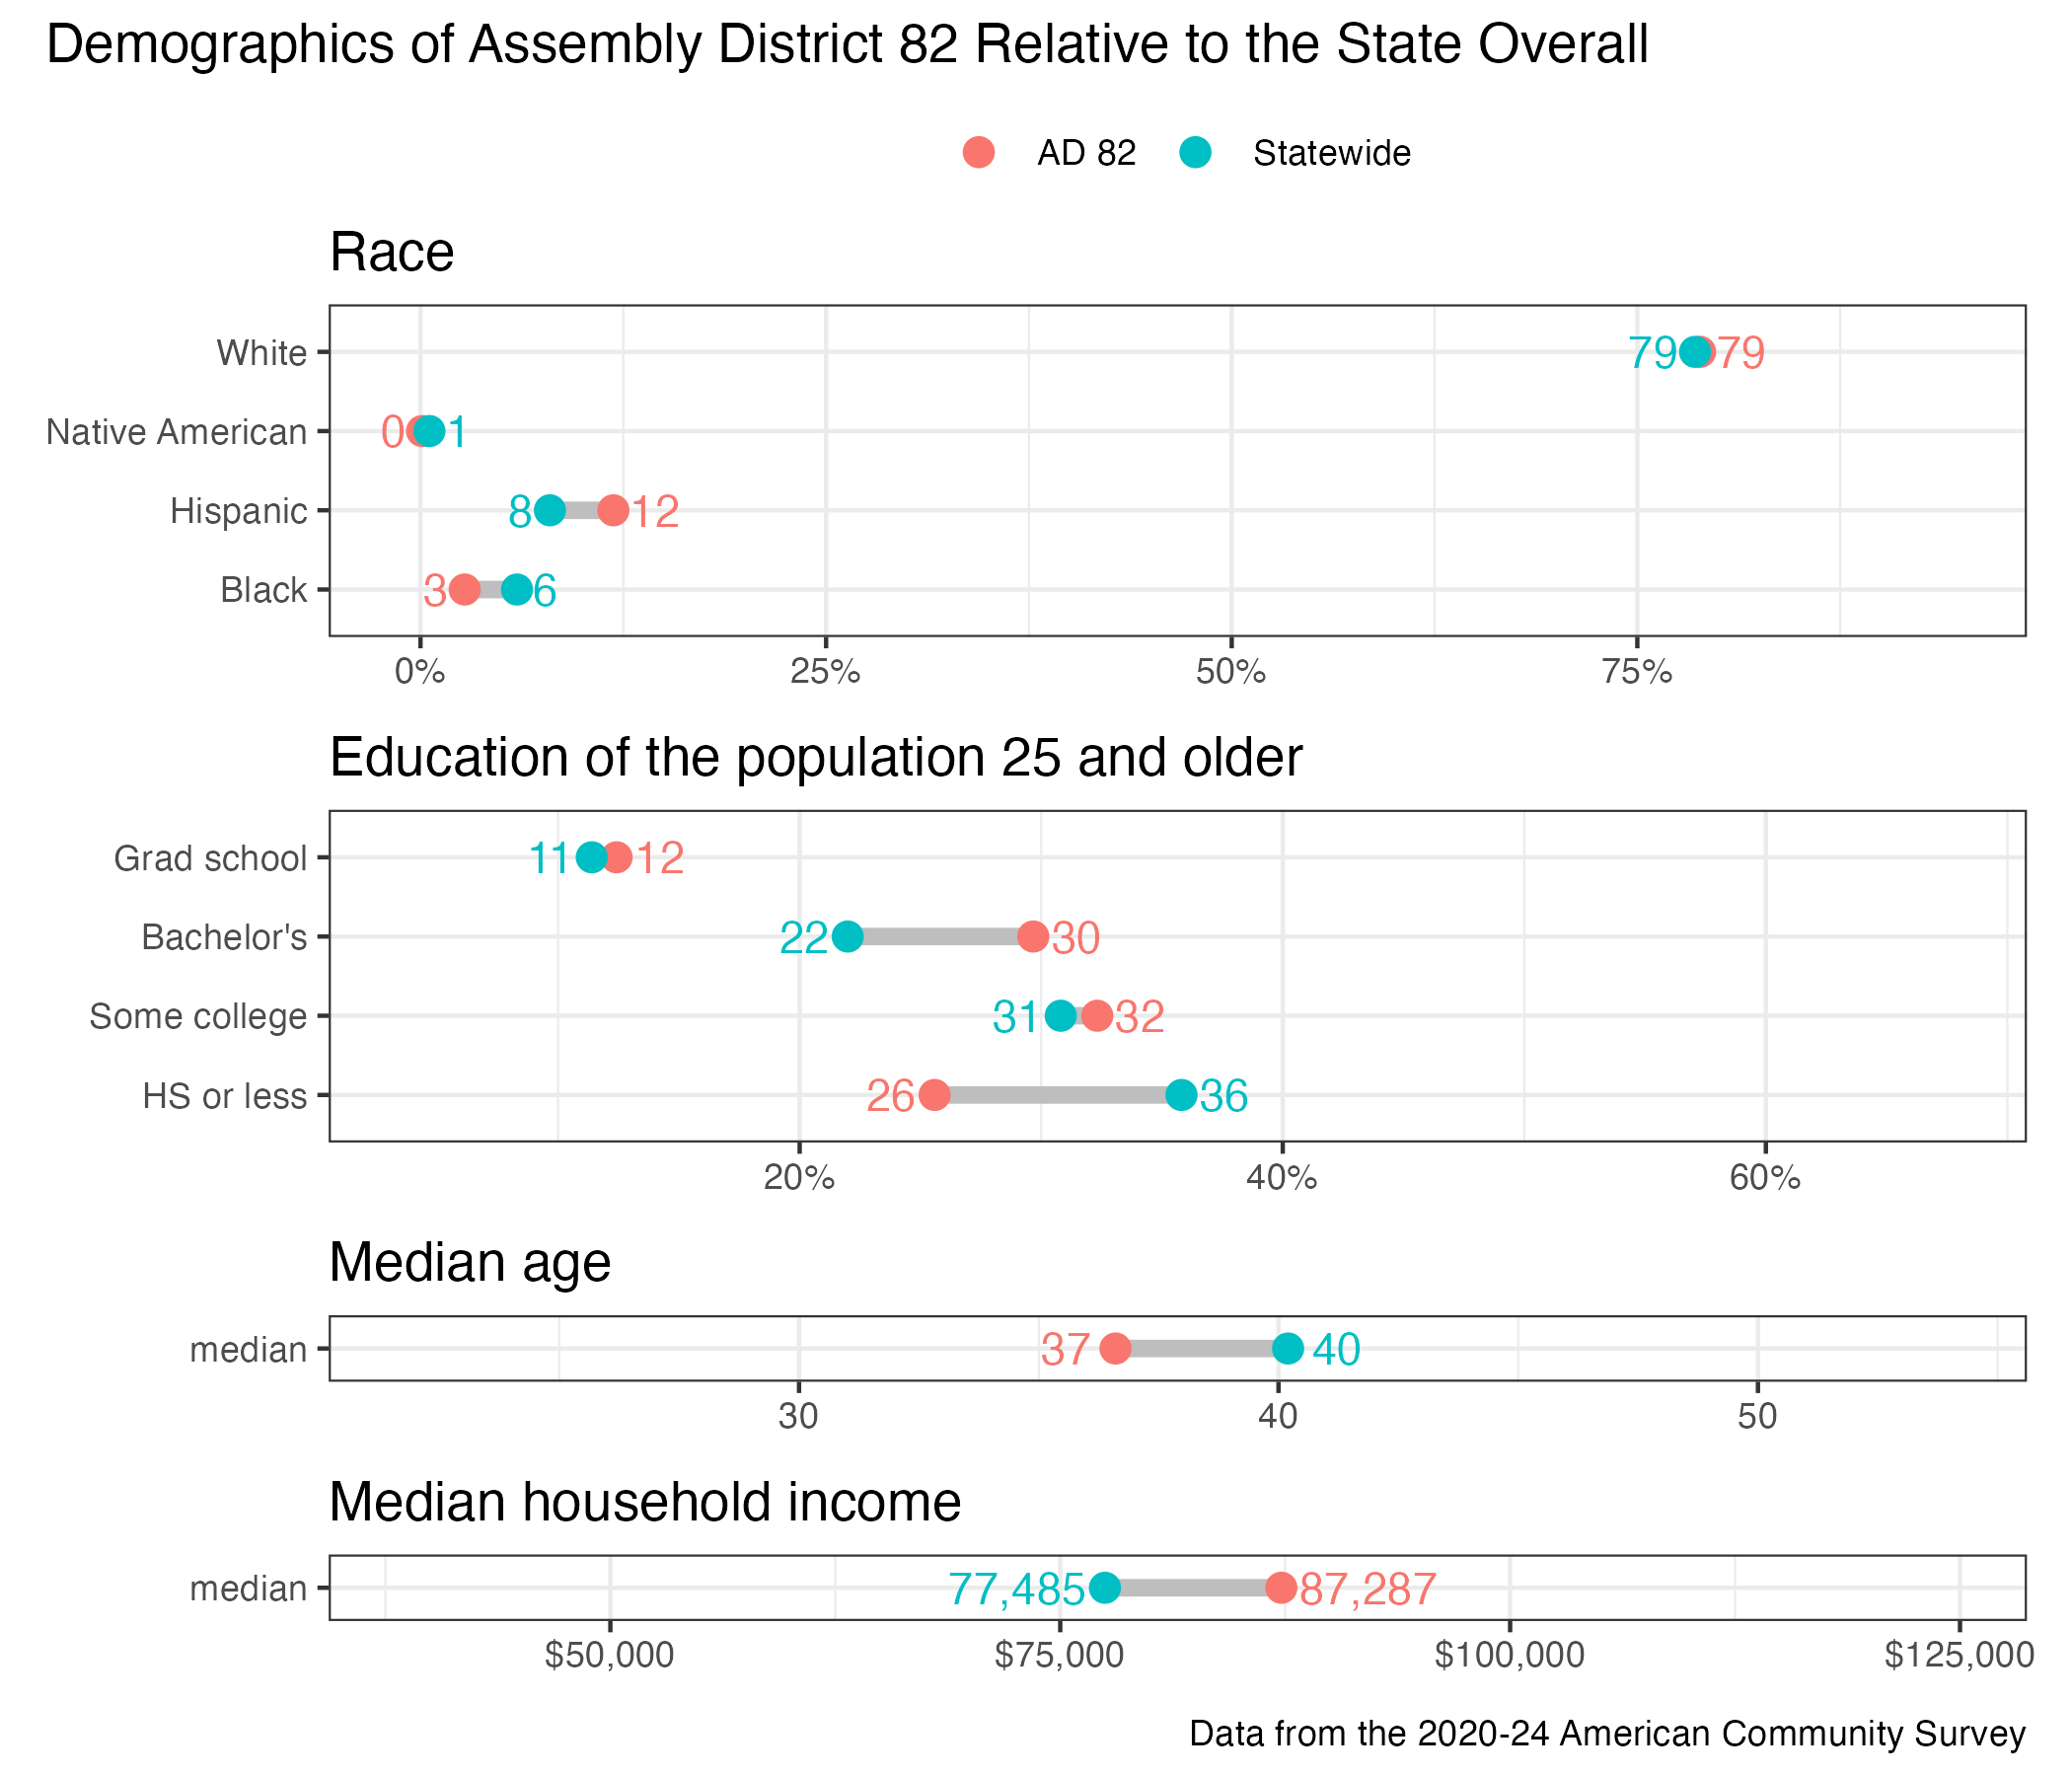
District demographics