72nd Assembly District
District
Candidates
| Assembly District 72 Candidates on the Primary Ballot | ||
| Incumbent: Scott Krug | ||
Jan 1 thru July 30
|
||
|---|---|---|
| receipts | disbursements | |
| Republican | ||
| Scott Krug | $29,312.50 | $26,722.62 |
| Democratic | ||
| Christine Maltese | $3,596.00 | $233.71 |
| Data from the 2026 July Continuing Report. Any amended reports might not yet be shown. | ||
Past election results
| Election Results in Wisconsin State Assembly District 72 | ||||||
votes
|
Dem. %1 |
margin (Dem. - Rep.)
|
||||
|---|---|---|---|---|---|---|
| total | Dem. | Rep. | votes | points2 | ||
| 2016 President | 30,068 | 11,203 | 17,412 | 39.2% | −6,209 | −21.7 |
| 2016 Senator | 29,773 | 12,145 | 16,352 | 42.6% | −4,207 | −14.8 |
| 2018 Governor | 26,814 | 11,189 | 15,120 | 42.5% | −3,931 | −14.9 |
| 2018 Senator | 26,716 | 12,838 | 13,848 | 48.1% | −1,010 | −3.8 |
| 2020 President | 33,687 | 12,976 | 20,231 | 39.1% | −7,255 | −21.8 |
| 2022 Governor | 27,140 | 10,846 | 15,845 | 40.6% | −4,999 | −18.7 |
| 2022 Senator | 27,139 | 10,291 | 16,785 | 38.0% | −6,494 | −24.0 |
| 2024 President | 35,328 | 13,215 | 21,276 | 38.3% | −8,061 | −23.4 |
| 2024 Senator | 34,956 | 13,676 | 20,282 | 40.3% | −6,606 | −19.5 |
| 2024 WI Assembly | 34,421 | 12,407 | 21,993 | 36.1% | −9,586 | −27.9 |
| 2025 WI Sup. Ct.3 | 23,760 | 10,139 | 13,600 | 42.7% | −3,461 | −14.6 |
| 1 Share of the two-party vote. For Rep. share, subtract from 100. | ||||||
| 2 Dem % of the two-party vote minus Rep % of the two-party vote | ||||||
| 3 Formally nonpartisan candidates assigned party labels based on state endorsements | ||||||
| Election results allocated into 2024 district boundaries based on population overlap. Calculations by John Johnson (johndjohnson.info). | ||||||
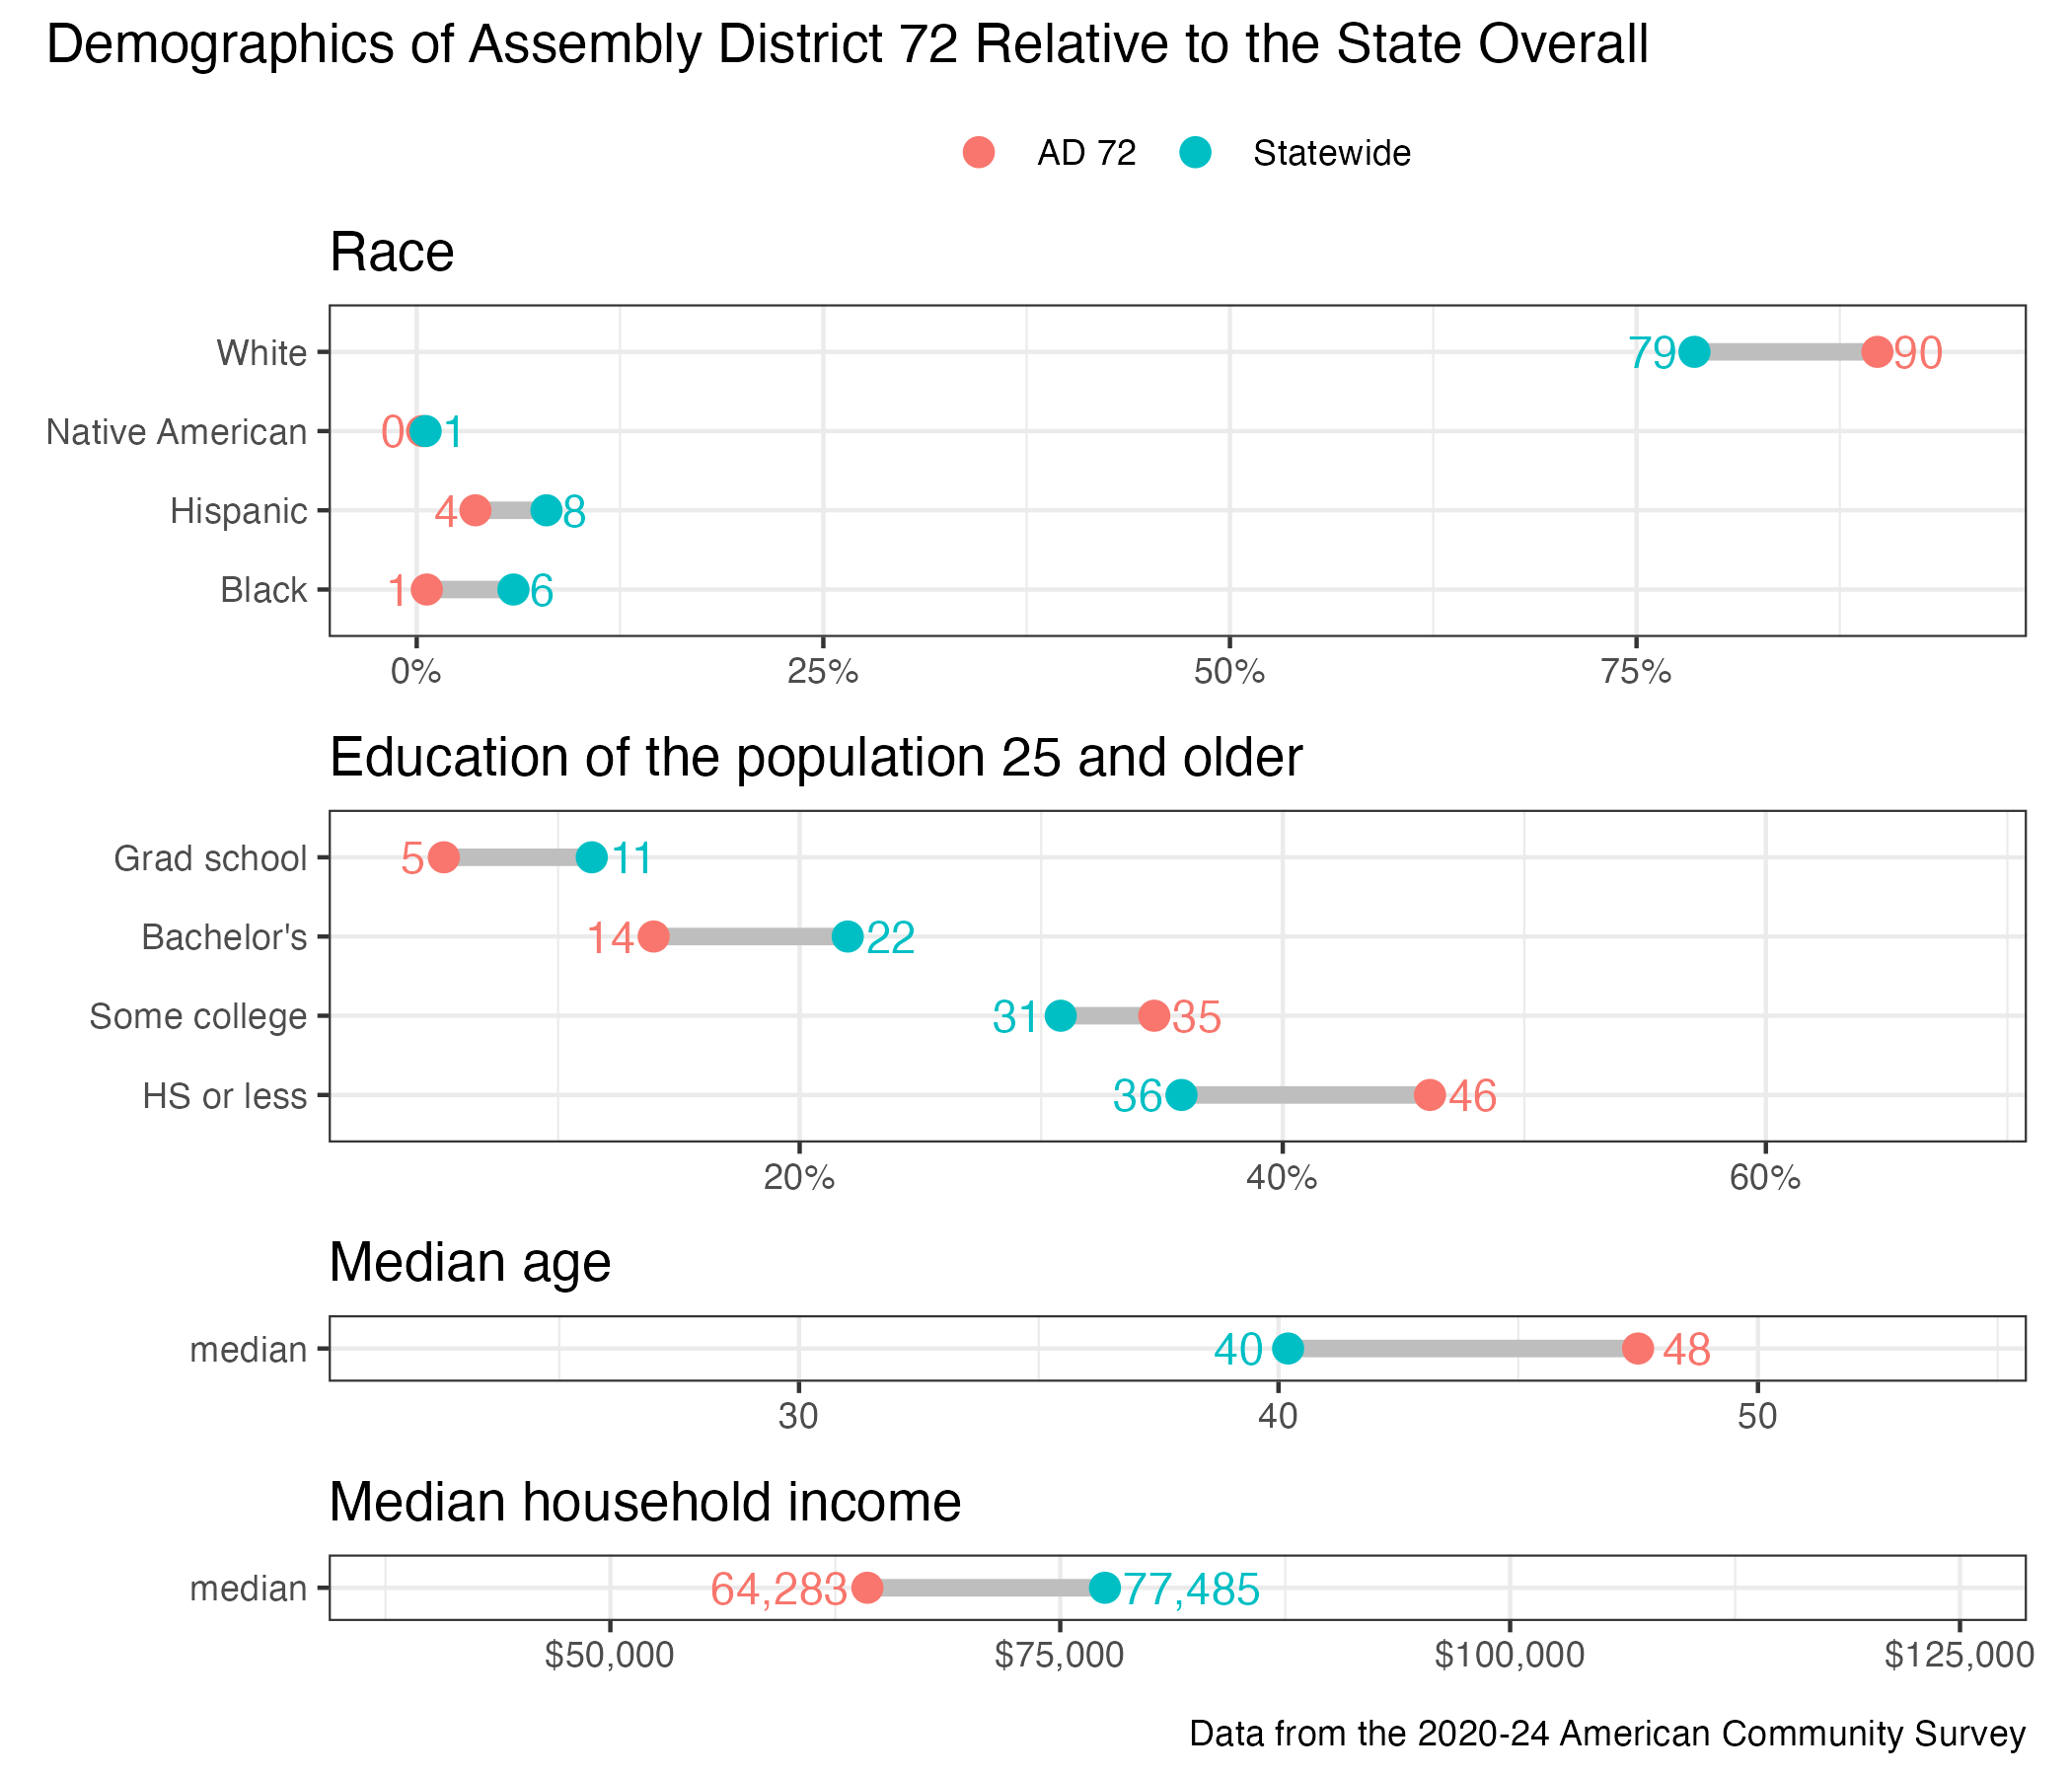
District demographics