21st Senate District
District
Candidates
| Senate District 21 Candidates on the Primary Ballot | ||
| Incumbent: Van H. Wanggaard (Filed Notification of Noncandidacy) | ||
Jan 1 thru July 30
|
||
|---|---|---|
| receipts | disbursements | |
| Republican | ||
| Jim Croft | $123,327.10 | $4,105.97 |
| Democratic | ||
| Trevor Jung | $174,702.91 | $21,733.84 |
| Data from the 2026 July Continuing Report. Any amended reports might not yet be shown. | ||
Past election results
| Election Results in Wisconsin State Senate District 21 | ||||||
votes
|
Dem. %1 |
margin (Dem. - Rep.)
|
||||
|---|---|---|---|---|---|---|
| total | Dem. | Rep. | votes | points2 | ||
| 2016 President | 89,813 | 41,679 | 42,782 | 49.3% | −1,103 | −1.3 |
| 2016 Senator | 89,353 | 39,964 | 47,262 | 45.8% | −7,298 | −8.4 |
| 2018 Governor | 82,854 | 38,741 | 42,446 | 47.7% | −3,705 | −4.6 |
| 2018 Senator | 82,375 | 43,770 | 38,481 | 53.2% | +5,289 | +6.4 |
| 2020 President | 99,201 | 49,970 | 47,688 | 51.2% | +2,282 | +2.3 |
| 2022 Governor | 76,768 | 39,280 | 36,732 | 51.7% | +2,548 | +3.4 |
| 2022 Senator | 76,765 | 37,993 | 38,603 | 49.6% | −610 | −0.8 |
| 2024 President | 99,982 | 49,550 | 48,319 | 50.6% | +1,231 | +1.3 |
| 2024 Senator | 98,794 | 49,384 | 47,177 | 51.1% | +2,207 | +2.3 |
| 2024 NA | NA | NA | NA | NA | NA | NA |
| 2025 WI Sup. Ct.3 | 68,098 | 37,656 | 30,398 | 55.3% | +7,258 | +10.7 |
| 1 Share of the two-party vote. For Rep. share, subtract from 100. | ||||||
| 2 Dem % of the two-party vote minus Rep % of the two-party vote | ||||||
| 3 Formally nonpartisan candidates assigned party labels based on state endorsements | ||||||
| Election results allocated into 2024 district boundaries based on population overlap. Calculations by John Johnson (johndjohnson.info). | ||||||
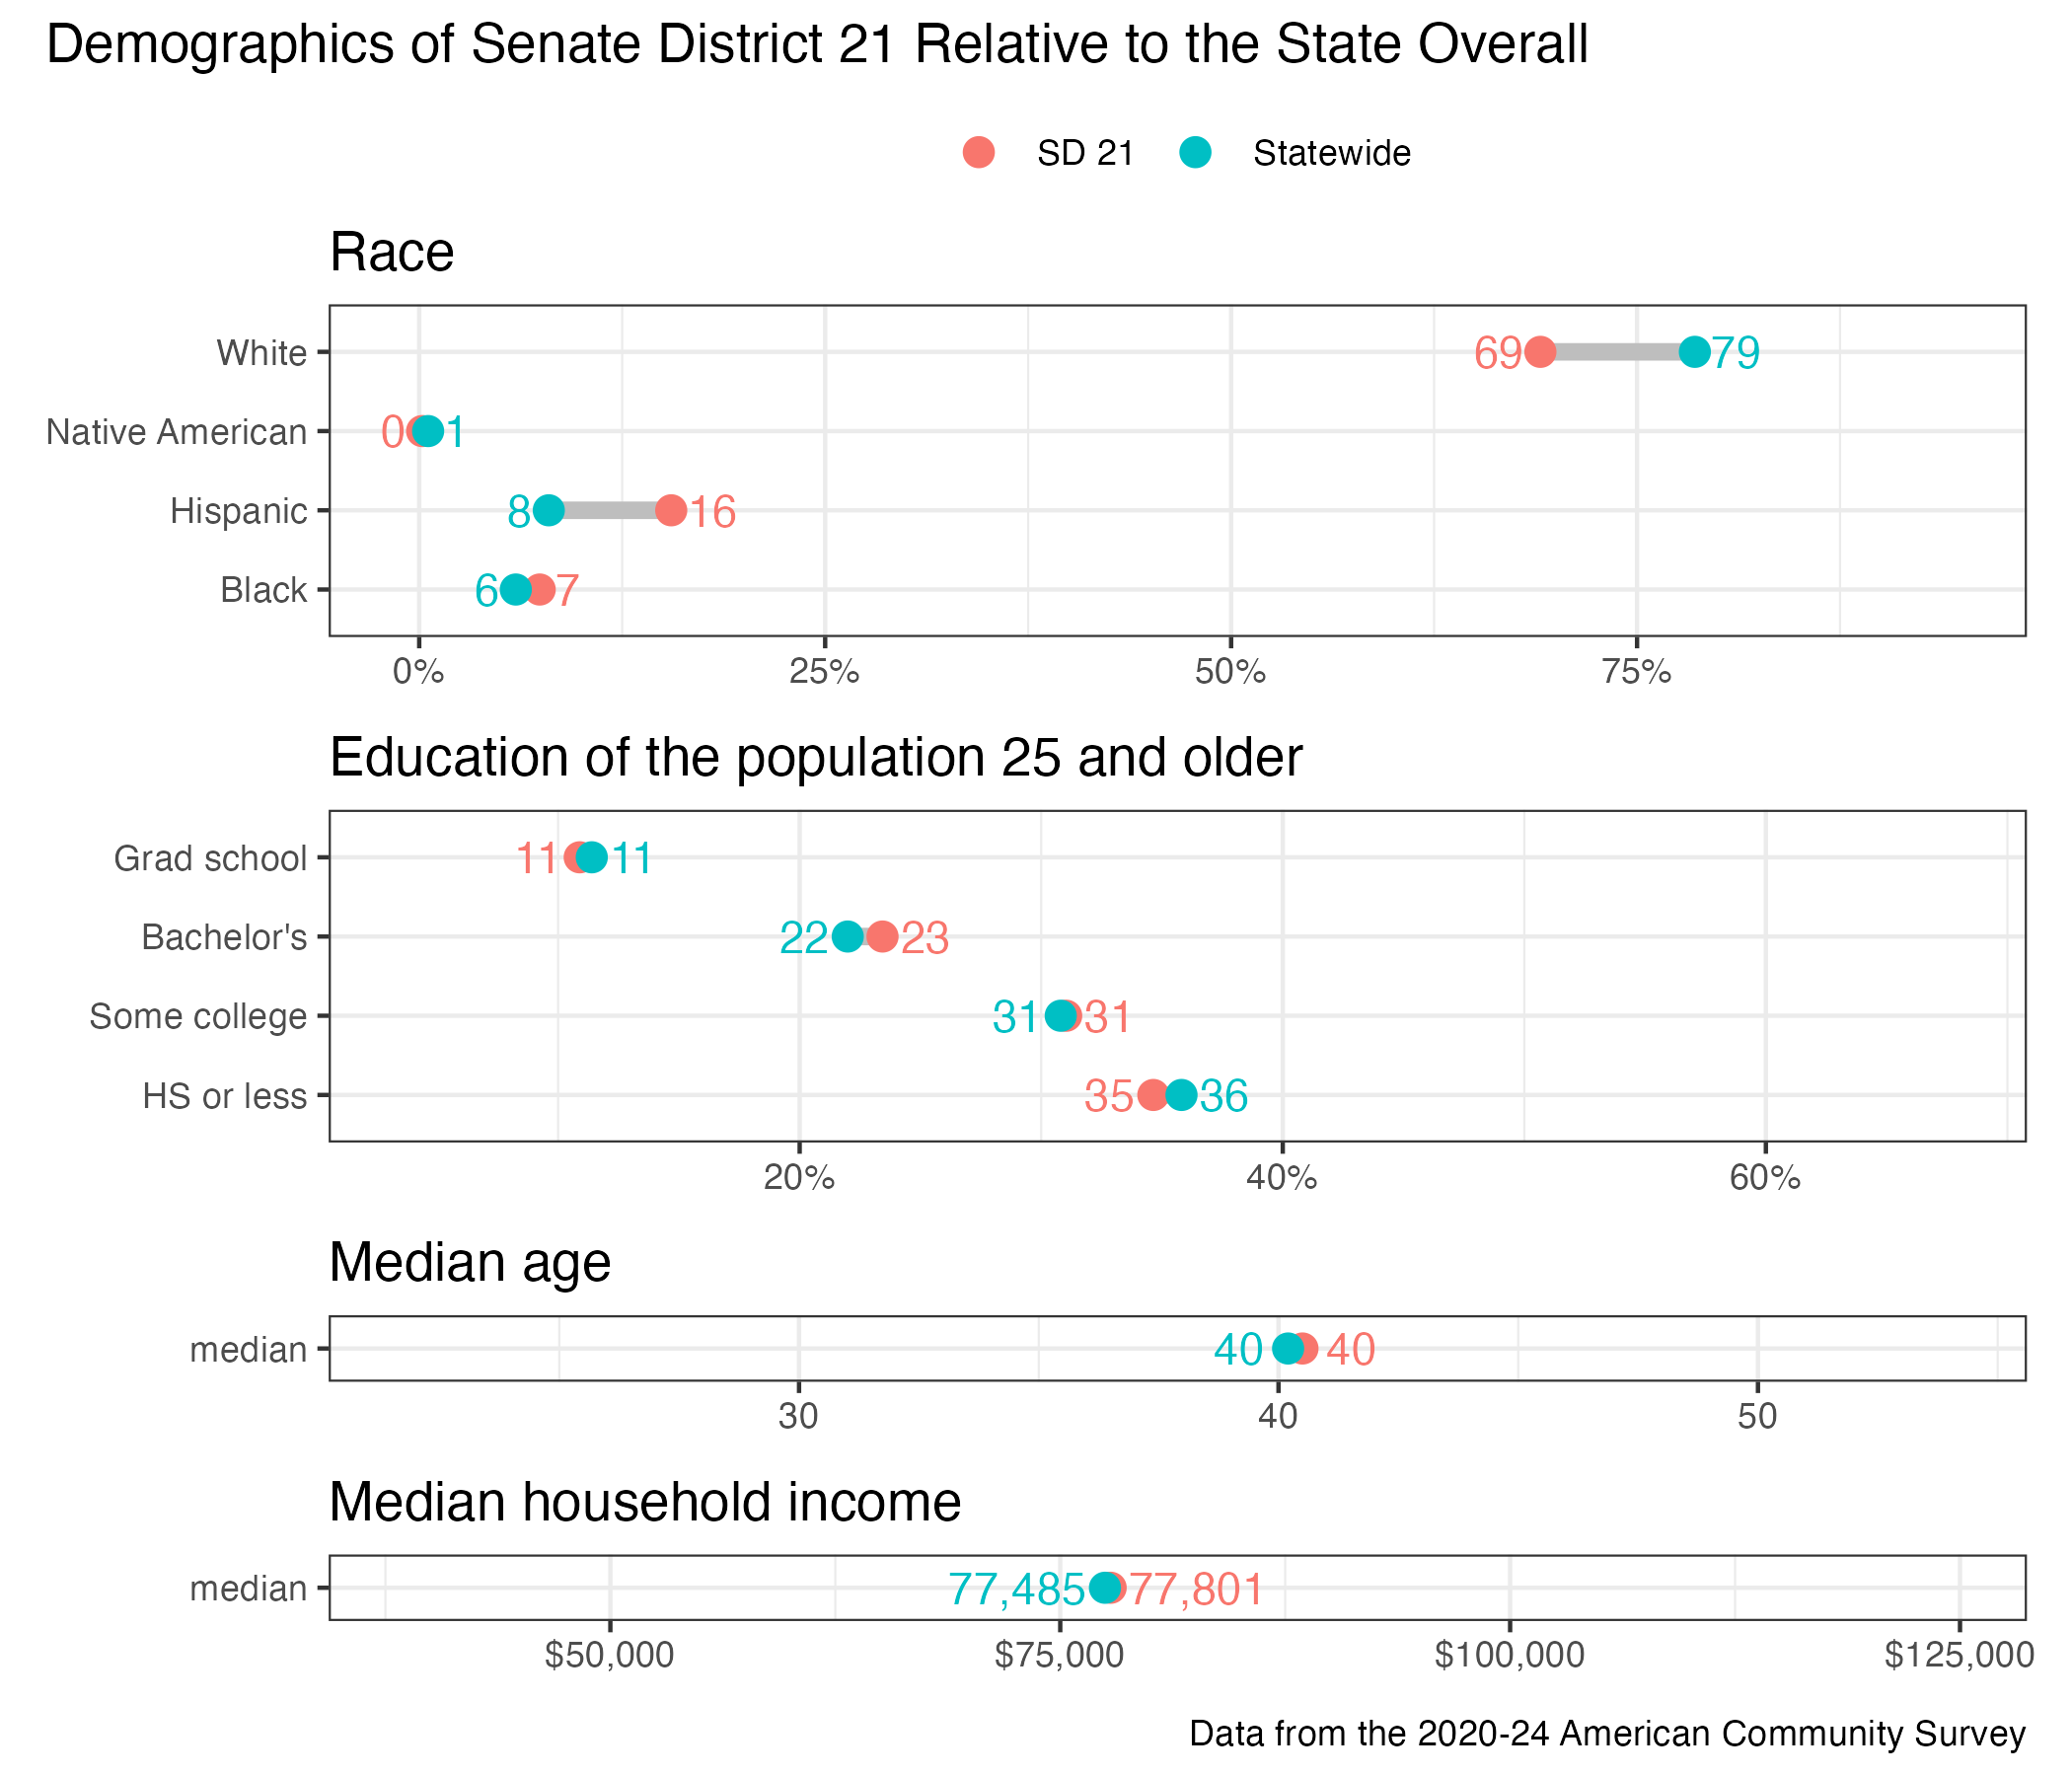
District demographics