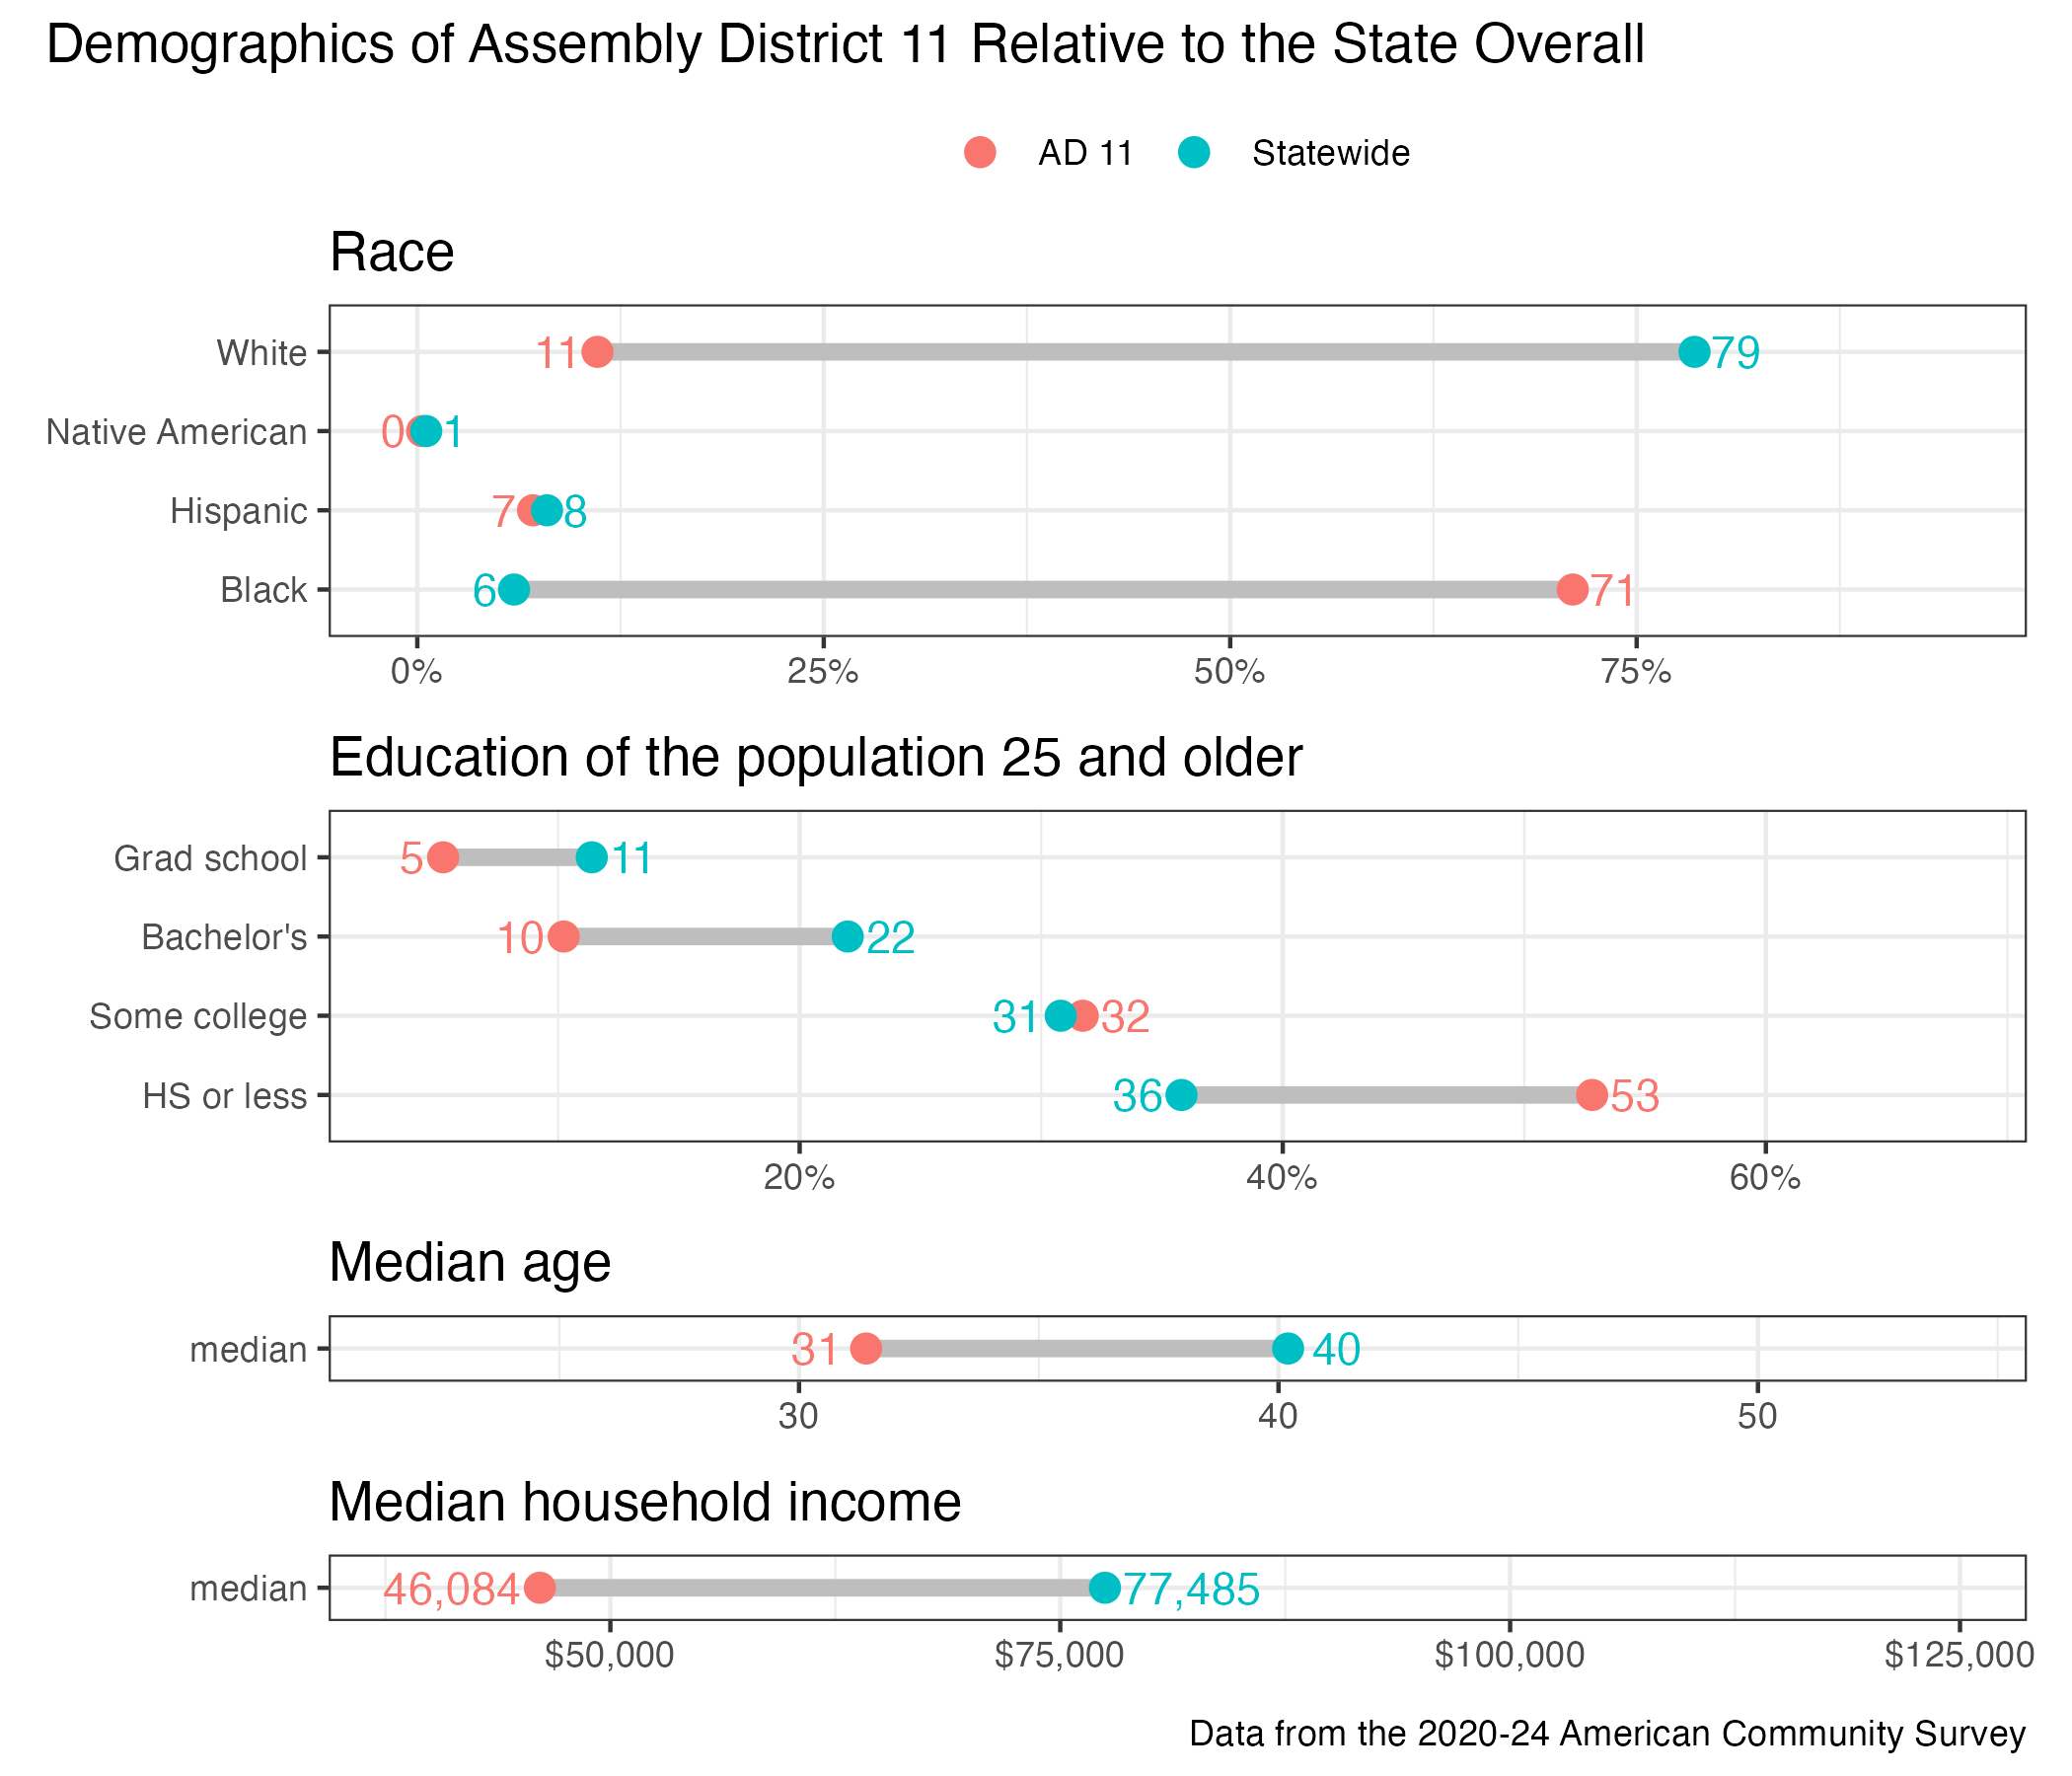
11th Assembly District
District
Candidates
| Assembly District 11 Candidates on the Primary Ballot | ||
| Incumbent: Sequanna Taylor | ||
Jan 1 thru July 30
|
||
|---|---|---|
| receipts | disbursements | |
| Republican | ||
| Shandowlyon Reaves | $2,590.00 | $1,350.92 |
| Democratic | ||
| Sequanna Taylor | $3,360.00 | $2,996.48 |
| Data from the 2026 July Continuing Report. Any amended reports might not yet be shown. | ||
Past election results
| Election Results in Wisconsin State Assembly District 11 | ||||||
votes
|
Dem. %1 |
margin (Dem. - Rep.)
|
||||
|---|---|---|---|---|---|---|
| total | Dem. | Rep. | votes | points2 | ||
| 2016 President | 25,262 | 22,215 | 2,377 | 90.3% | +19,838 | +80.7 |
| 2016 Senator | 24,737 | 21,294 | 2,980 | 87.7% | +18,314 | +75.4 |
| 2018 Governor | 21,174 | 18,482 | 2,339 | 88.8% | +16,143 | +77.5 |
| 2018 Senator | 21,221 | 19,170 | 2,022 | 90.5% | +17,148 | +80.9 |
| 2020 President | 24,325 | 21,322 | 2,725 | 88.7% | +18,597 | +77.3 |
| 2022 Governor | 16,051 | 14,243 | 1,636 | 89.7% | +12,607 | +79.4 |
| 2022 Senator | 16,273 | 14,510 | 1,735 | 89.3% | +12,775 | +78.6 |
| 2024 President | 24,234 | 21,042 | 2,815 | 88.2% | +18,227 | +76.4 |
| 2024 Senator | 23,867 | 20,797 | 2,521 | 89.2% | +18,276 | +78.4 |
| 2024 WI Assembly | 20,646 | 20,392 | 0 | 100.0% | +20,392 | +100.0 |
| 2025 WI Sup. Ct.3 | 12,818 | 11,477 | 1,326 | 89.6% | +10,151 | +79.3 |
| 1 Share of the two-party vote. For Rep. share, subtract from 100. | ||||||
| 2 Dem % of the two-party vote minus Rep % of the two-party vote | ||||||
| 3 Formally nonpartisan candidates assigned party labels based on state endorsements | ||||||
| Election results allocated into 2024 district boundaries based on population overlap. Calculations by John Johnson (johndjohnson.info). | ||||||
District demographics